Price tags that never cover each other
A trading chart puts a dozen tags on its price axis, and the interesting ones sit at the same price. How TradeCanvas lays them out so each stays readable, and the bugs that taught us where else they collide.
Os artigos são escritos em inglês.
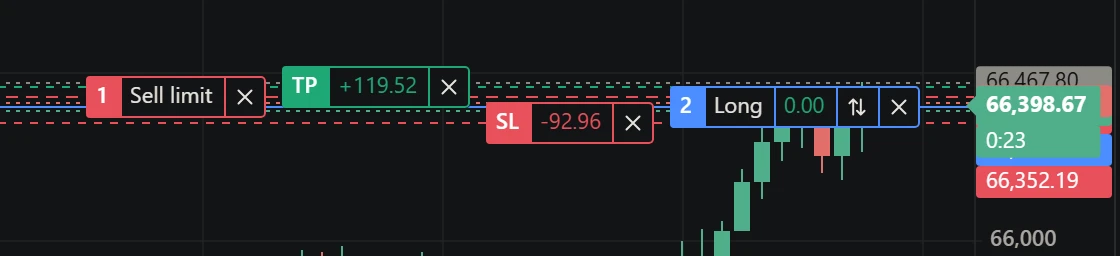
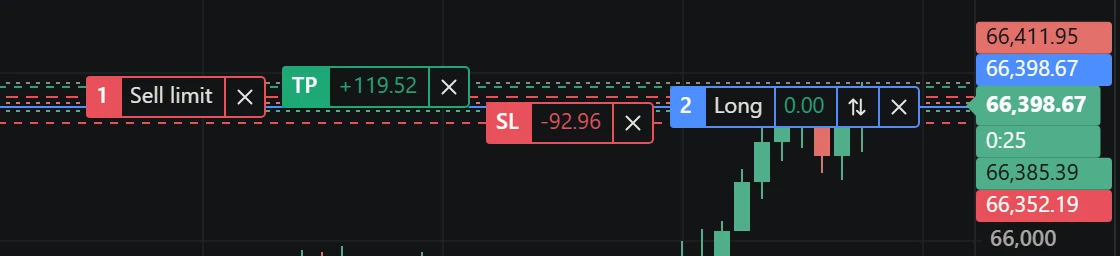
Look at the right edge of a trading chart while a position is open. There is the last price, with the time left in the bar under it. There is the position’s entry, its stop and its target. A limit order waits a few ticks away. With quotes on, the bid and the ask sit either side of the last price. The day’s high and low have tags, and on a market with daily limits so do the ceiling, the floor and the reference price.
Most of these are interesting precisely when they are close together: the price is about to touch your order, the stop is a tick under the bid. That is when a naive chart draws them on top of each other and you can read none of them.
Why “spread them out” is not enough
The obvious fix is to sort the tags by price and push each one down until it clears the one above. That works for a static picture. On a live chart it fails in a way you notice at once: the last price moves every tick, and a sort-and-push layout moves every tag below it along with it. Your stop’s tag jumps up and down while the stop has not moved. The axis becomes the least trustworthy thing on the screen.
So the layout needs a fixed point. In TradeCanvas that is the last price: its tag always sits on its line, because it is the number you look at most and the one that moves. Everything else is placed relative to it.
One anchor, two directions
The tags above the last price are pushed up; the tags below it are pushed down. Each moves only as far as the tag nearer the anchor needs it to, so a tag leaves its own line only when another one would cover it.
let ceiling = at[still] - tags[still].above;
for (const i of up) {            // nearest the anchor first
  if (at[i] + tags[i].below > ceiling) at[i] = ceiling - tags[i].below;
  ceiling = at[i] - tags[i].above;
}
let floor = at[still] + tags[still].below;
for (const i of down) {
  if (at[i] - tags[i].above < floor) at[i] = floor + tags[i].above;
  floor = at[i] + tags[i].below;
}
Two details matter more than they look:
- Tags are not all the same height. The last price’s tag carries the bar countdown under it, so it reaches further down than up. Each tag says how far it reaches above and below its line, and the layout uses those, not one fixed height.
- A tag on the anchor’s own price goes above it. A position opened at the market sits exactly on the last price. Ties have to break the same way every frame, or the two tags swap places as the price flickers.
When the last price has no tag to anchor to (its tag is hidden, or the price is scrolled off the plot), the tag nearest the middle of the group stays put instead.
What does not fit is left out
Push enough tags down and the last one runs off the bottom of the plot, onto the time axis. Clamping it to the edge would put it back on top of another tag, which is the problem we started with. So a tag pushed past the plot is not drawn at all, while a tag that is still on its own line is always drawn: if your stop is at the bottom edge, you see it.
The value tags of indicators and drawings go in the gaps between those tags, each gap laid out with a simpler two-pass version: a downward pass that keeps each tag a height below the one above, then an upward pass that brings back what ran off the bottom of the gap. They need no anchor of their own: the tags that matter more are already fixed around them.
The other things that sit on a tag
Fixing the axis did not end it. Two bugs found after it shipped, one reported by a developer building on the widget and one by our own browser audit, were about things drawn over the tags on the trading lines, inside the plot:
- The “+” by the price axis. The button that follows the crosshair to place an order or an alert sat at the right edge of the plot, which is exactly where an order’s tag ends, with its close button. It covered the close button and took the click meant for it. Now, while the “+” is turned on, the tags end to the left of its strip.
- The legend. On a phone, the OHLC legend at the top of the plot runs most of the way across. A take-profit near the top of the range had its tag under the legend’s text. The legend is drawn on a layer above the tags (it repaints on every pointer move, the tags do not), so the fix is to clip the legend around each tag. The tag stays whole; the part of the legend behind it is left out.
Both bugs had the same shape as the axis one: two things that are each correct on their own, placed by code that does not know about the other. The fix each time was to give one of them a rectangle to keep out of.
Turning it off
If you place your own tags or want them back on their lines, chart.setAxisLabelsAligned(false) turns the layout off (orders and positions are then only spread among themselves), and the widget offers it as “No overlapping labels” in the price scale menu. The function that places them, alignAxisTags, is exported from @tradecanvas/core if you draw tags of your own and want them to behave the same way.