Rủi ro và lợi nhuận
Code
Xem tài liệu →import { ScatterChart } from '@tradecanvas/chart'
new ScatterChart(el, {
series: [{ name: 'Holdings', points }], // { label, x, y, size }
xLabel: 'Volatility',
yLabel: '1-year return',
showLabels: true,
theme: 'dark',
})● Dữ liệu thị trường giả lập, sinh ngay trong trình duyệt của bạn
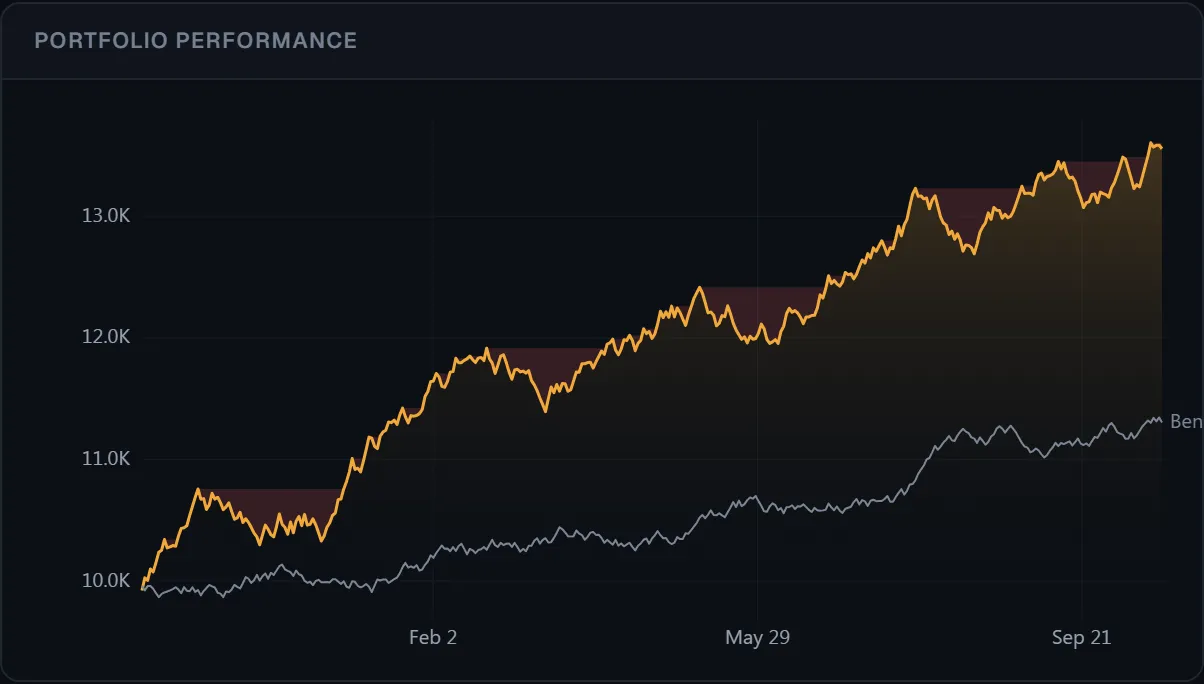
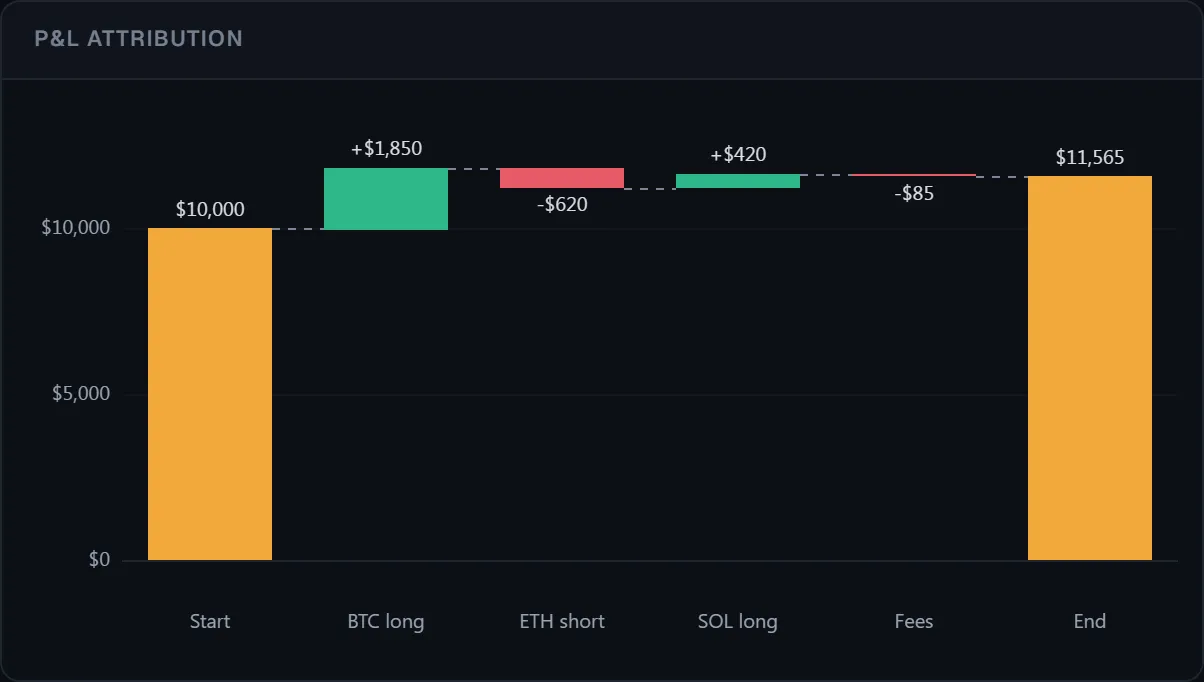
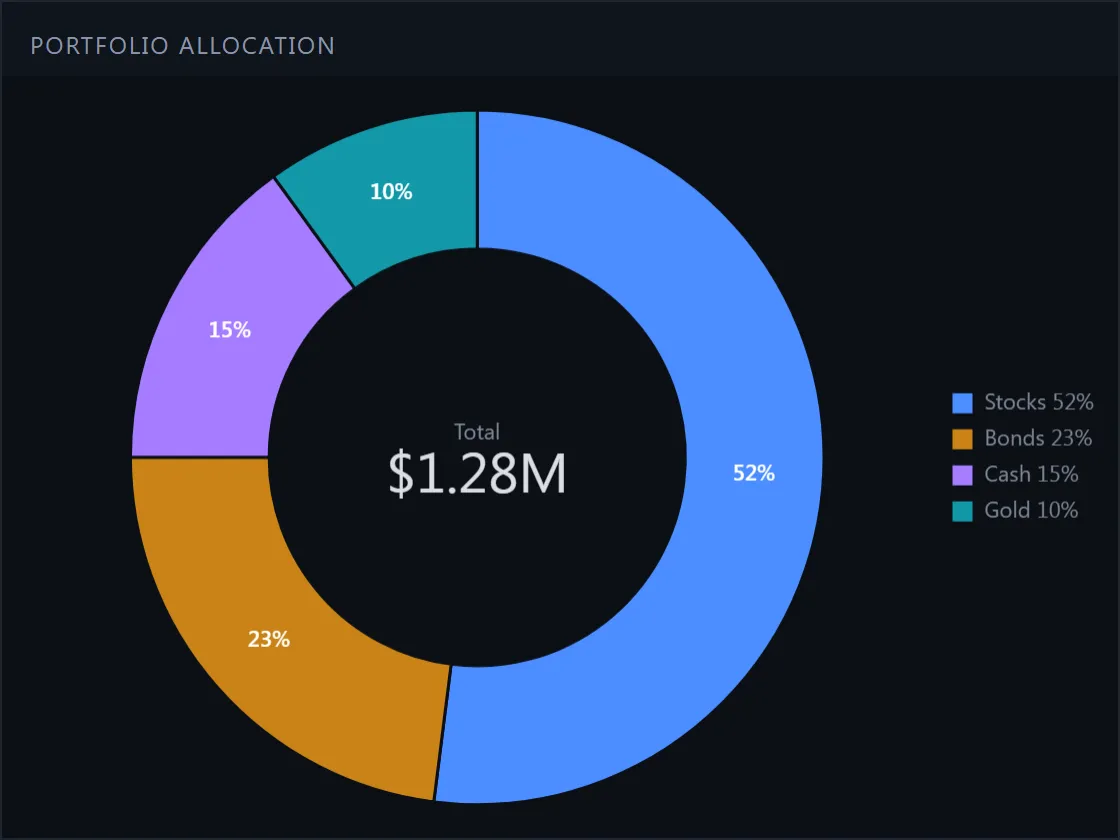
Cho những gì nhà giao dịch xem sau phiên: lãi lỗ, sụt giảm, phân bổ, rủi ro và lợi nhuận.
API: ScatterChart