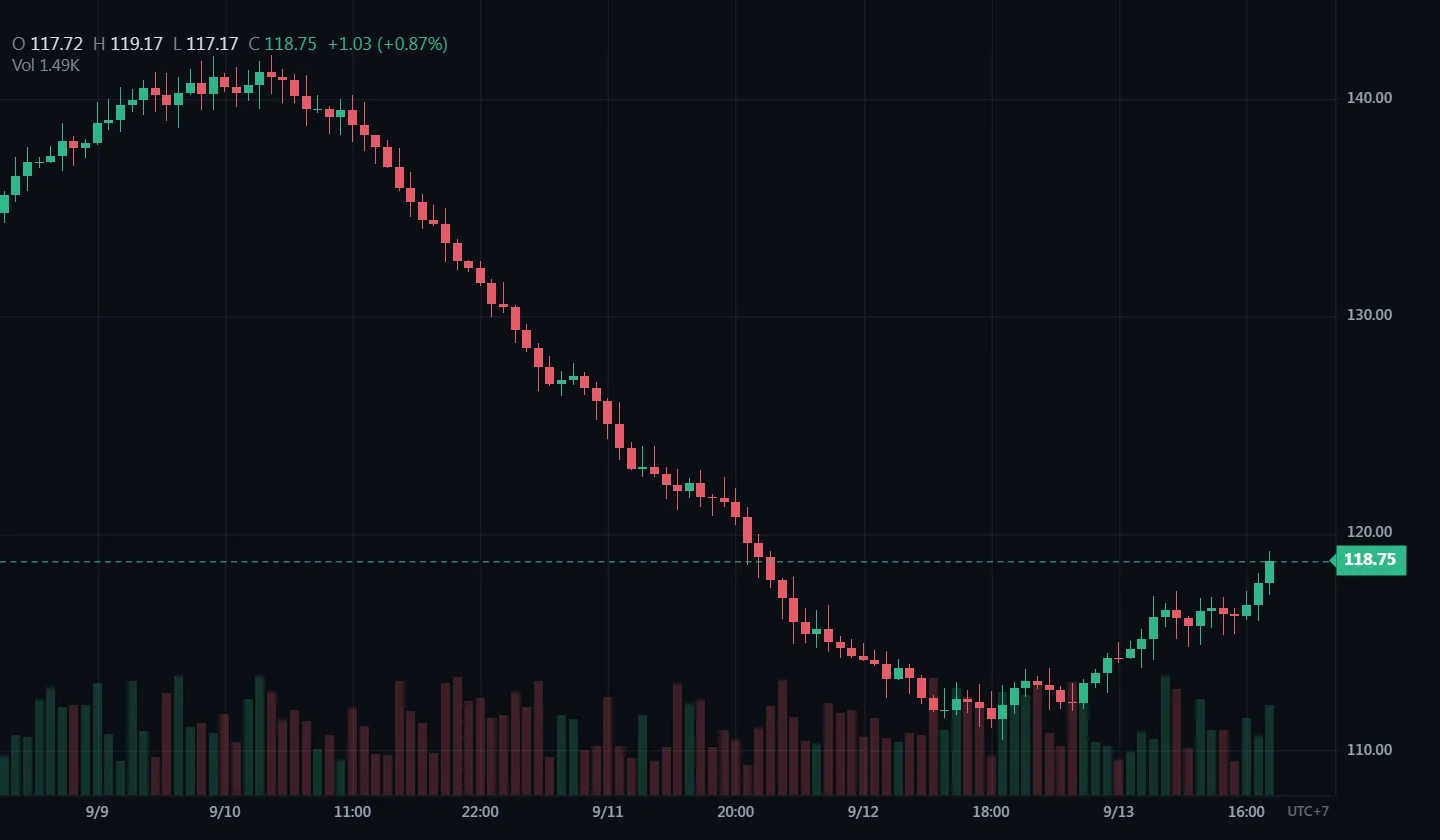
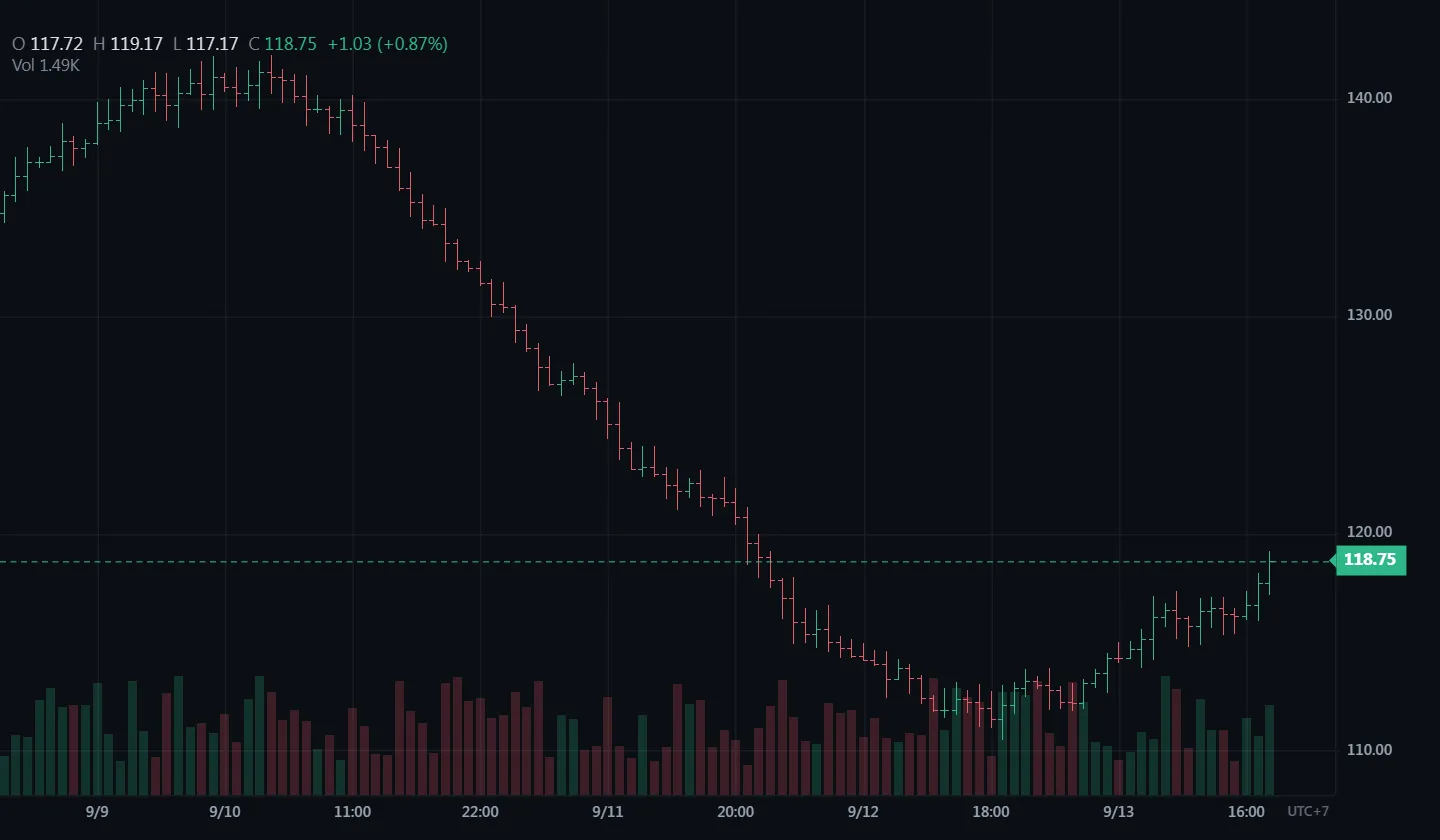
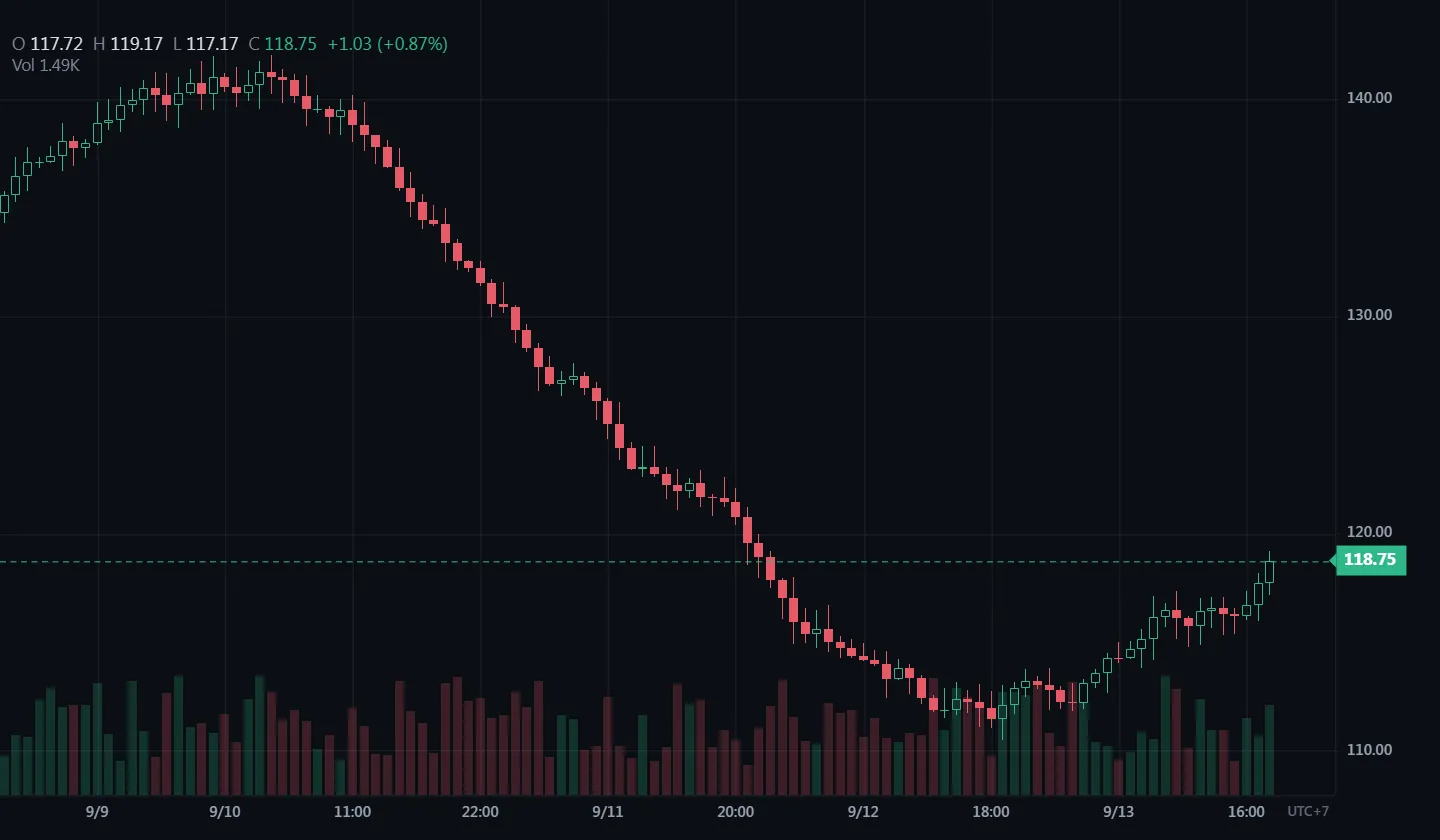
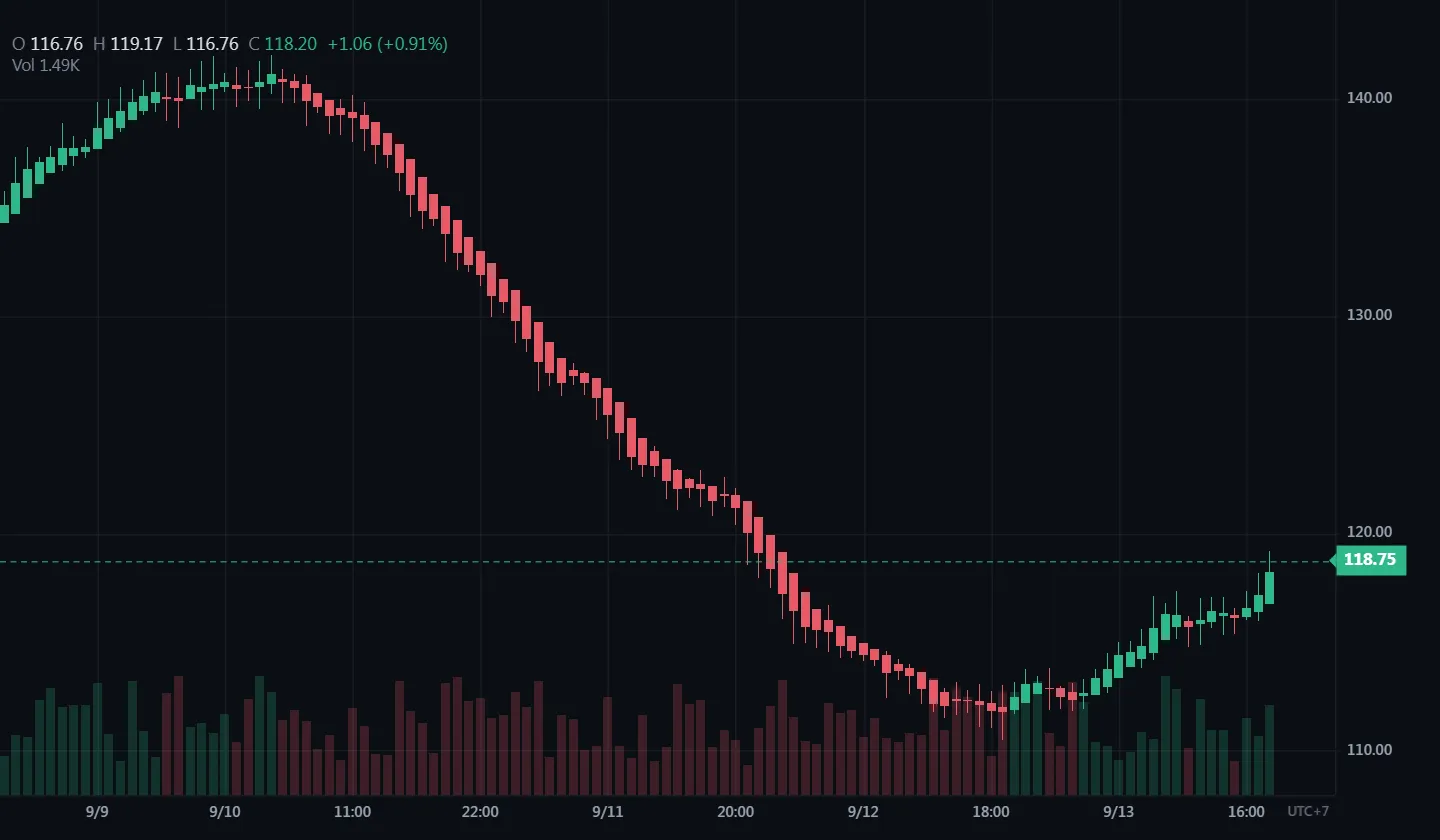
Equivolume
Code
Read the docs →import { Chart } from '@tradecanvas/chart'
const chart = new Chart(document.getElementById('chart')!, {
theme: 'dark',
chartType: 'equivolume',
})
chart.setData(bars) // OHLCV bars, oldest first
chart.setChartType('equivolume') // switch at any time● Simulated market data, generated in your browser
Time-based and price-based. Renko, Kagi, line break, point & figure and range bars build their own bars from yours.
API: chartType: 'equivolume'