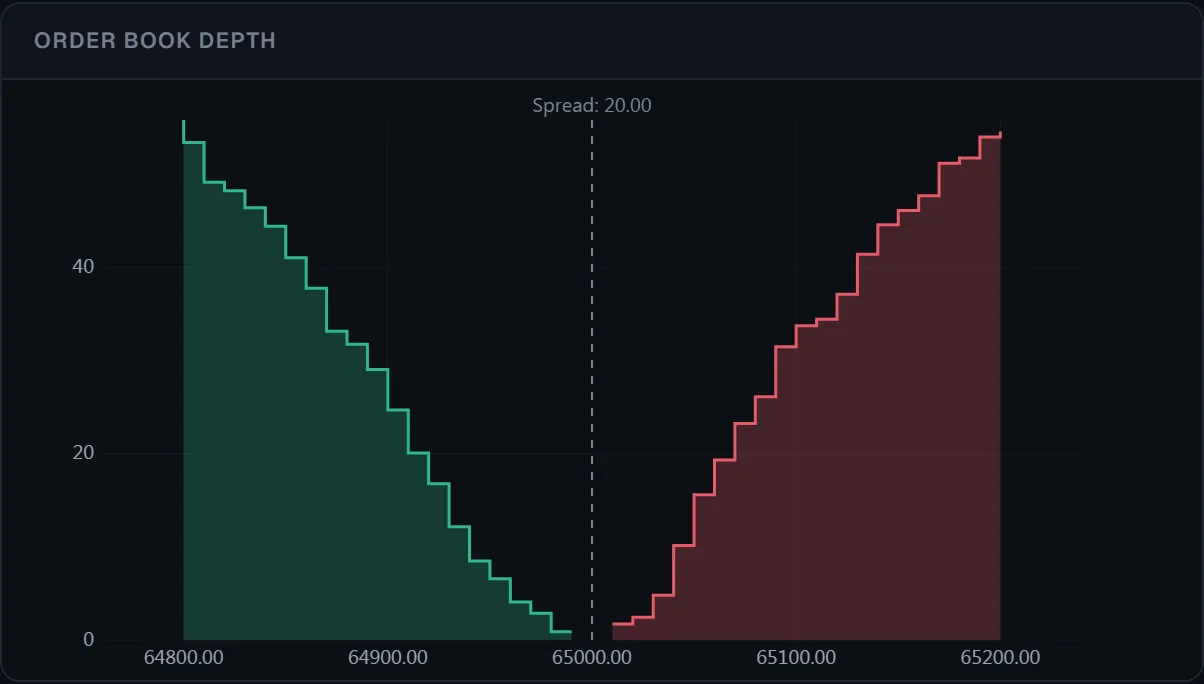
유동성 히트맵
코드
문서 보기 →import { Chart } from '@tradecanvas/chart'
const chart = new Chart(el, { theme: 'dark', renderer: 'webgl' })
chart.setData(bars)
chart.setDepthHeatmapVisible(true)
// Each order-book snapshot becomes a column of the heatmap behind the price
chart.pushDepthSnapshot(book, Date.now())● 브라우저에서 생성한 시뮬레이션 시장 데이터
마지막 체결가만이 아니라 호가 전체를 봅니다: 깊이, GPU 유동성 히트맵, 클릭 주문 래더, 볼륨 프로파일.
API: pushDepthSnapshot