Drawing where there are no bars yet: Ichimoku's cloud
Ichimoku plots its cloud 26 bars ahead of the price, where a chart has no bars, no times and no values. For a while TradeCanvas drew it under the price instead. What it took to put it where it belongs.
Статьи написаны на английском.
Most indicators are a value per bar: a moving average at each close, an RSI under each candle. Ichimoku Kinko Hyo is the well-known exception. Two of its five lines, Lead A and Lead B, are worked out on a bar and then drawn 26 bars later, and the band between them is the cloud. The point of the indicator is that the cloud runs ahead of the price: the latest bar’s values sit 26 bars into the future, as support or resistance the price has not reached yet. The lagging span goes the other way, each close drawn 26 bars back.
That is an awkward shape for a chart library, because everything about a bar series assumes the values stop where the bars stop. Until version 1.57.0, TradeCanvas drew the cloud on the bar it was worked out on. An earlier changelog even said so, in passing. Here is the same made-up market drawn by 1.56.0 and by the current version:
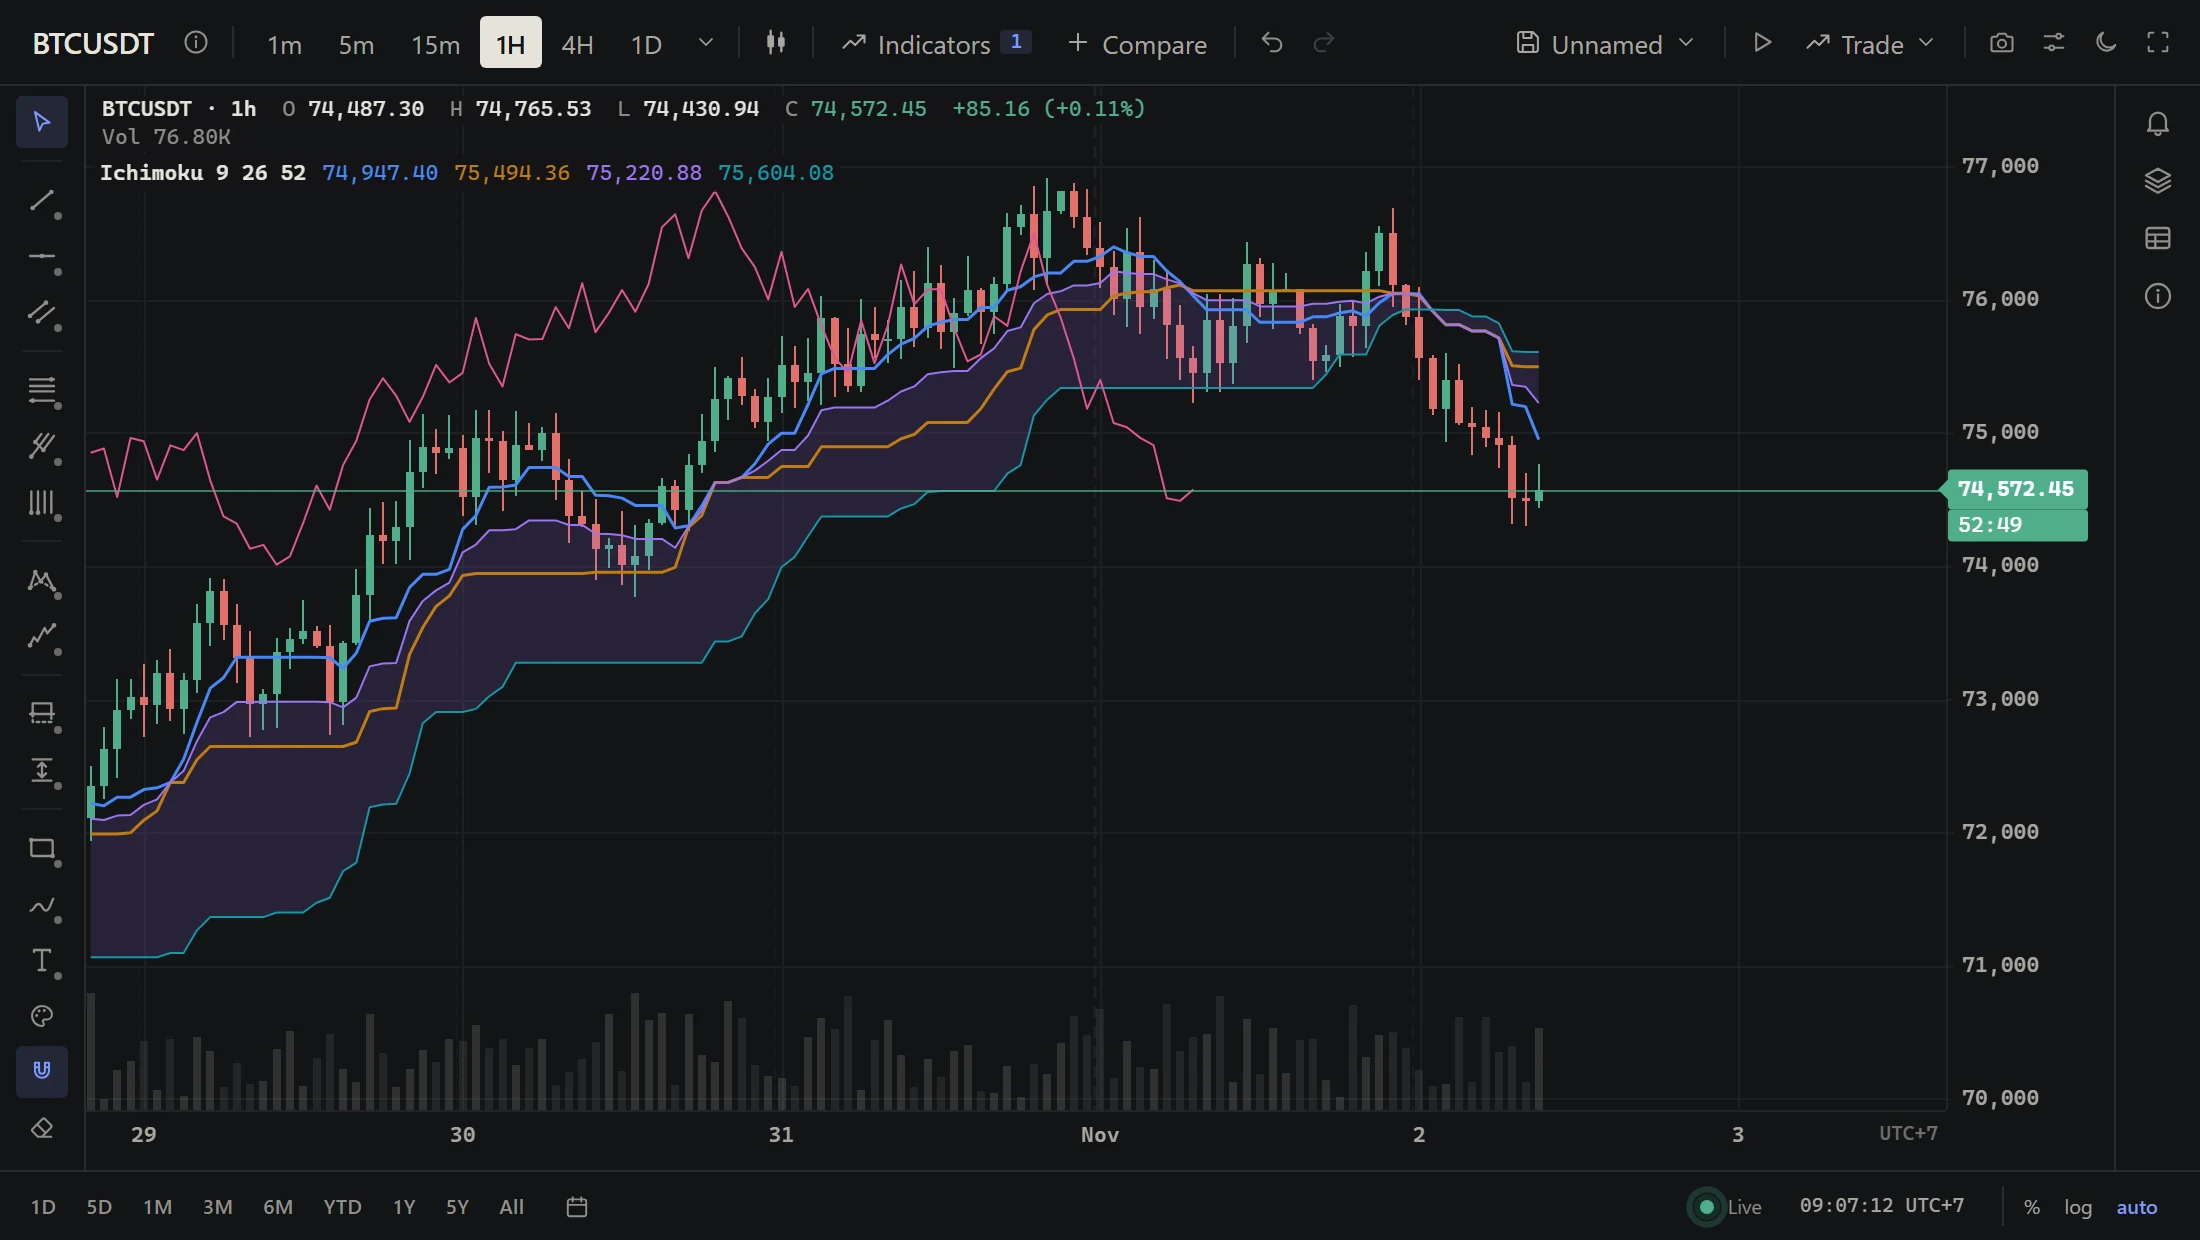
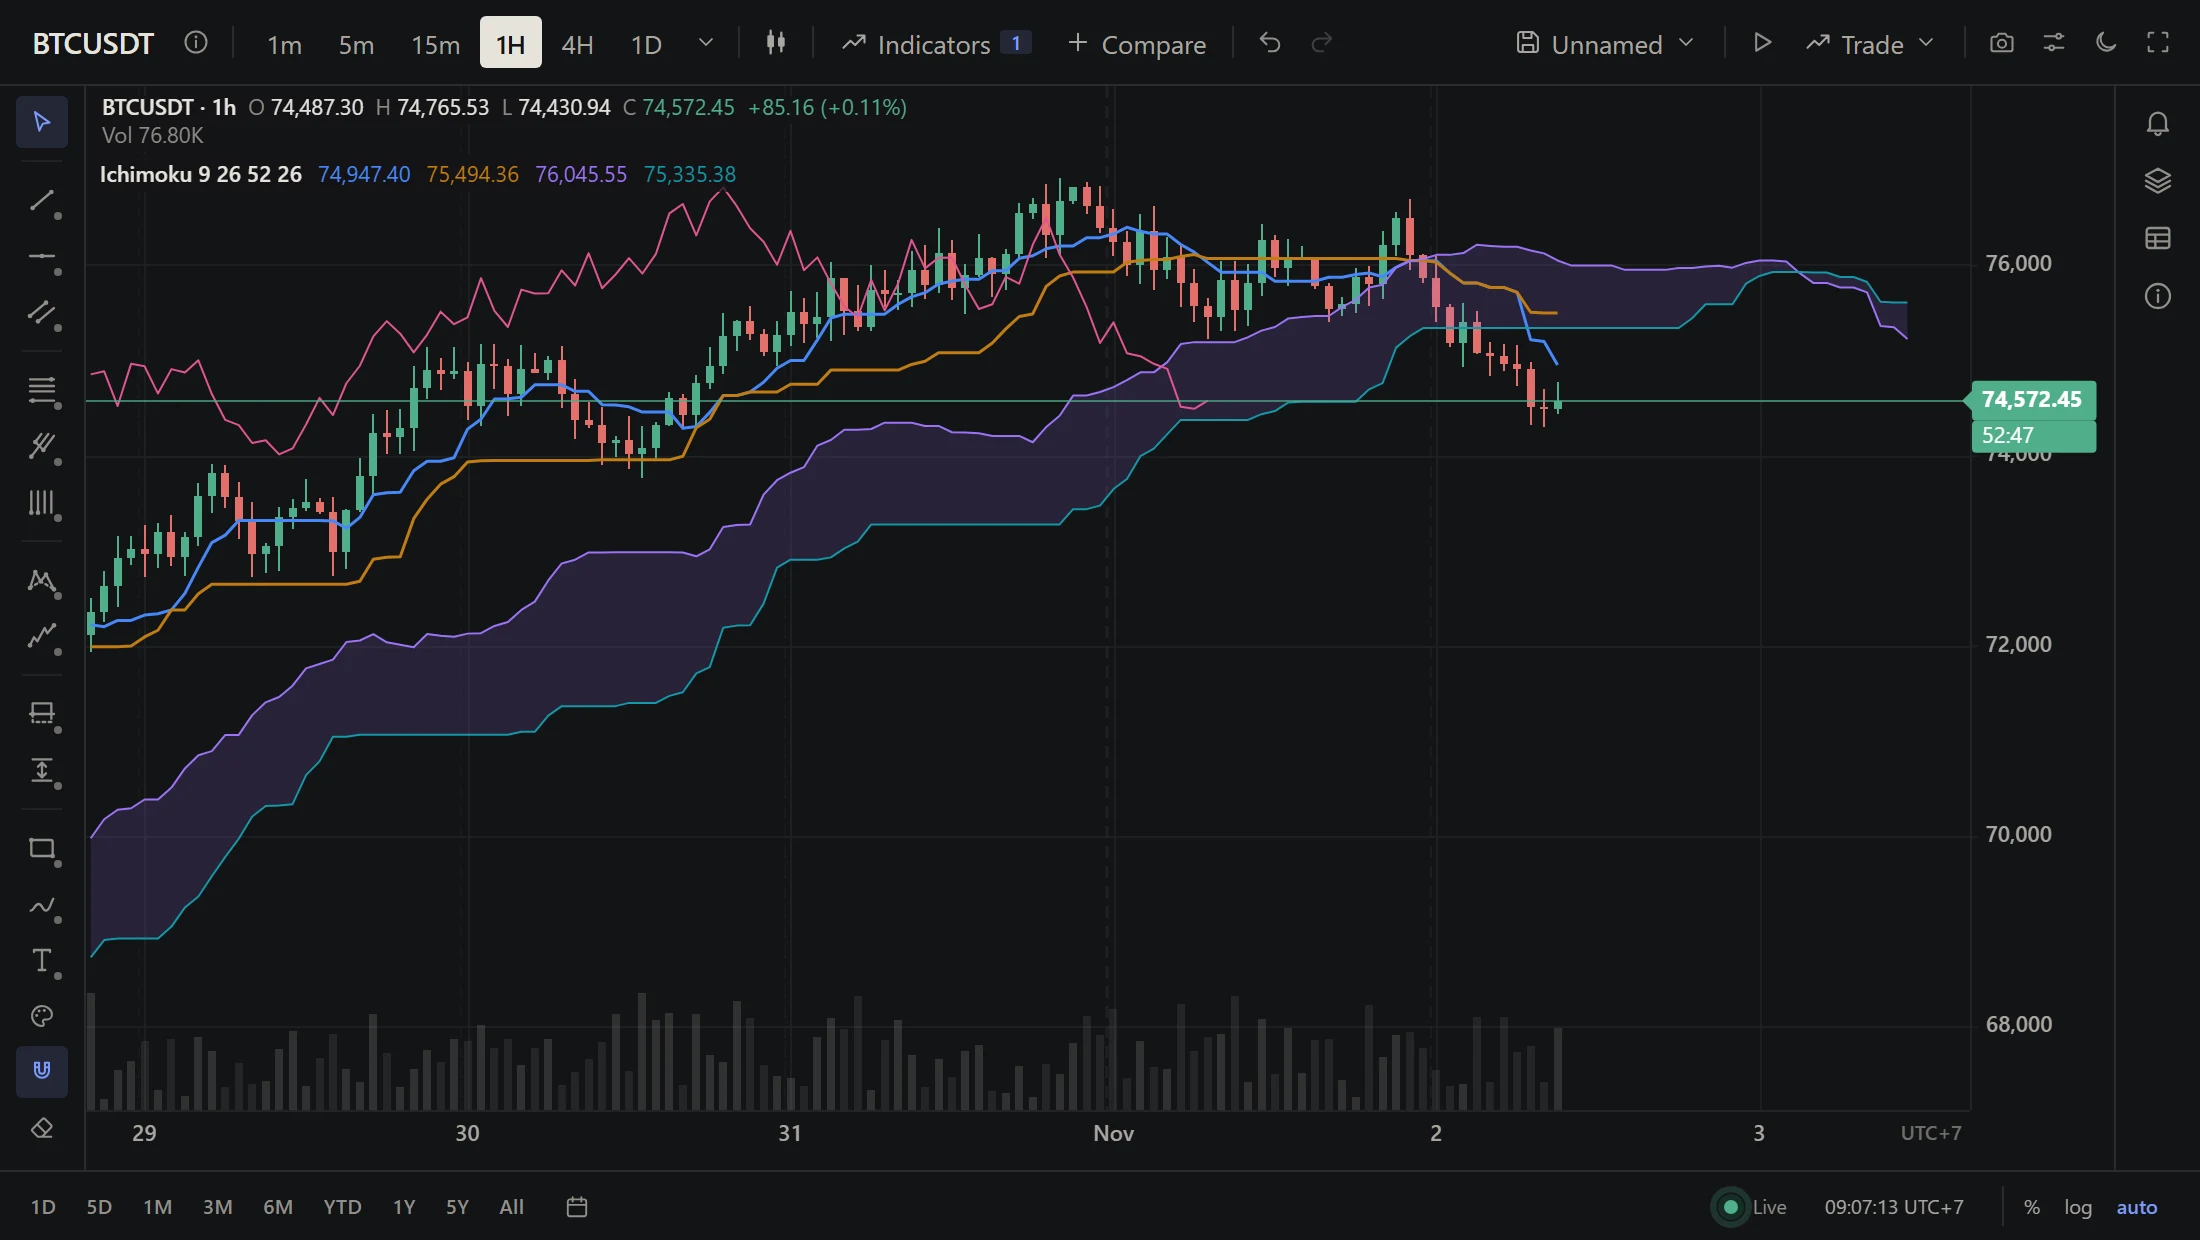
Moving the lines 26 bars to the right inside the data is easy. The hard part is the end: the last 26 bars’ cloud belongs on bars that do not exist yet.
Where do values for missing bars live?
An indicator in TradeCanvas returns a series: one entry per bar, in the bars’ order. The renderer, the price scale, the legend, the data window and the export all walk that array by bar index. There is no slot 26 places past the end.
The first idea is to give it slots: append 26 empty bars to the data so the cloud has somewhere to sit. We did not, because the bars are the chart’s truth. The last bar is the last price, the one an order or an alert is checked against; other indicators would see 26 bars with no prices; an export would carry 26 blank rows; a replay would step into them. Every piece of code that reads the bars would have to learn to skip them.
So the bars stay as they are, and the indicator says more about its own output. Its series still has one entry per bar, and each bar’s Lead A and Lead B are now the ones worked out the displacement before. The cloud of the last bars goes into a short list next to the series, with the index of the bar its first entry belongs on:
// The cloud of the last bars, for the bars ahead of the latest:
// `ahead[k]` goes on bar `aheadFrom + k`.
const first = Math.max(0, data.length - displacement);
const ahead = [];
for (let i = first; i < data.length; i++) ahead.push(leadAt(i));
return { values, series, meta: { ahead, aheadFrom: first + displacement } };meta.ahead holds.Three readers that have to agree
Putting the values somewhere was half of it. Three parts of the chart read indicator values, and each had to learn about the list ahead, or the chart would contradict itself.
- The renderer. A bar index maps to an x position by arithmetic, so an index past the last bar is just further right. The cloud is drawn from the bars in view and then from the list ahead, stopping one bar past the plot’s right edge. It is filled only where both lead lines exist: Lead B needs 52 bars of history, Lead A only 26, so the start of the cloud is a line before it is a band.
- The price scale. With auto-scale on, the scale fits what is drawn. Values ahead count while the latest bar is in view, since that is when the cloud ahead can be on screen. Without this, a cloud ahead that runs below every candle would be cut off at the bottom of the plot.
- The legend, the data window and the export. Under the pointer, Lead A at a bar is the value drawn at that bar, not the one worked out there. Moving only the drawing would have left the legend 26 bars behind the line: the kind of mismatch nobody reports but everybody notices.
Time in the future
The cloud ahead sits over empty space, and that space has to have times: the time axis labels it, the crosshair reads it, and a trend line can be drawn into it. TradeCanvas places a slot past the latest bar one typical bar interval after the one before. The typical interval is the median of the last twenty, so one weekend gap in the data does not stretch every future slot to two days.
That is an estimate, and it is the right kind. Ichimoku counts bars, not hours: 26 periods ahead means 26 bars, whatever calendar they fall on. On a stock that does not trade at weekends, the slots ahead are where the next bars will go, and the dates under them are only a guess at when those bars will come. A trend line anchored in the future keeps its time as bars arrive, because its anchor is a time. Where that time falls among the real bars is worked out again each frame, so on a market with gaps it can shift once the bars are there.
How many bars is 26?
Writing this post turned up a question the fix did not settle. Every description says the lead lines go 26 periods into the future and the lagging span 26 back, but not whether the bar the value is worked out on counts as the first of the 26. If it does, the cloud lands 25 bars on; if it does not, 26.
The written descriptions do not say. StockCharts, the help pages of TradingView, MetaTrader 5 and thinkorswim all put it as 26 periods ahead. The reference manual of the R package ichimoku is the one that spells it out: the lead lines are plotted ahead 26 periods “including the current period”, which is 25 bars after the bar they are worked out on. Code is unambiguous, so we read the open-source implementations we could find:
| Implementation | The cloud, bars after the bar it is worked out on |
|---|---|
| Highcharts Stock | 25 (and the lagging span 25 back) |
| ta4j (Java) | 25 |
| backtrader (Python) | 26 (and the lagging span 26 back) |
ta (Python), with visual=True |
26 |
| TradeCanvas | 26 (and the lagging span 26 back) |
There is no standard to follow, so TradeCanvas keeps 26: changing it would move every user’s cloud by a bar for no better reason. The input that sets it is displacement, the distance in bars, so matching a product that counts the current bar is one option:
chart.addIndicator('ichimoku', { displacement: 25 });It moves the lagging span the same way, 25 bars back. If you compare our cloud with another product’s bar for bar and it is one bar out, this is why.
What we changed in how we test
The bug was not subtle once seen, and it stayed until 1.57.0 because nothing made us look: unit tests checked the values, and the values were right, just drawn on the wrong bars. 1.54.0 even noted it and moved on. Two things changed:
- The indicator’s tests now check where each value lands, including the list ahead and the case with fewer bars than the displacement.
- The browser audit we run before every change to the chart gained an Ichimoku scene, so the cloud is looked at, in both themes and at three widths, along with the other states that dialogs never show.
Writing this post, we went to take a picture of that scene and found it had dropped out of the audit’s default list within the hour, when a scene for Korean markets was added in its place rather than beside it. It is back. A check you cannot see running is a check you do not have.
The general lesson is the one this blog keeps coming back to: a chart is a picture, and the values being right is not the same as the picture being right.
Источники
- StockCharts ChartSchool, Ichimoku Cloud
- ichimoku: Cloud Charts, the reference manual (R package)
- Highcharts Stock, the Ichimoku indicator's source
- ta4j, IchimokuSenkouSpanAIndicator
- backtrader, the Ichimoku indicator
- ta (Python), trend indicators
- TradingView Help Center, Ichimoku Cloud
- MetaTrader 5 Help, Ichimoku Kinko Hyo
- thinkorswim Learning Center, Ichimoku