損益瀑布圖
程式碼
閱讀文件 →import { WaterfallChart } from '@tradecanvas/chart'
new WaterfallChart(el, {
data: steps, // { label, value, type?: 'total' }
showValues: true,
theme: 'dark',
})● 模擬行情資料,在你的瀏覽器中產生
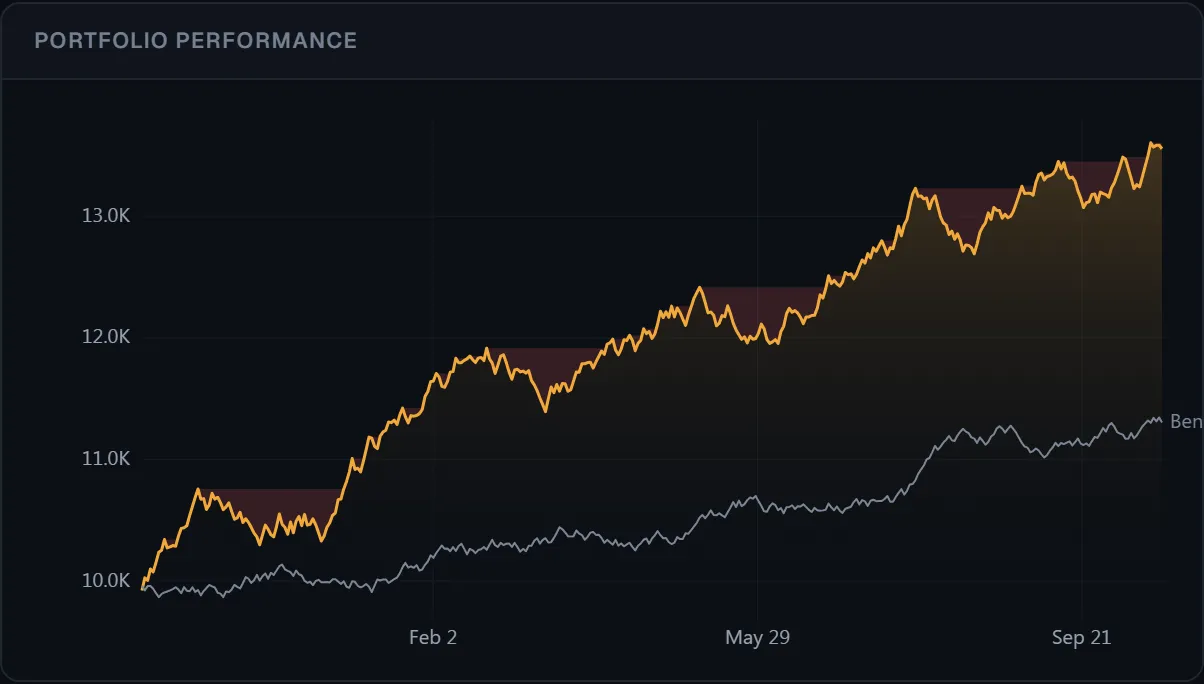
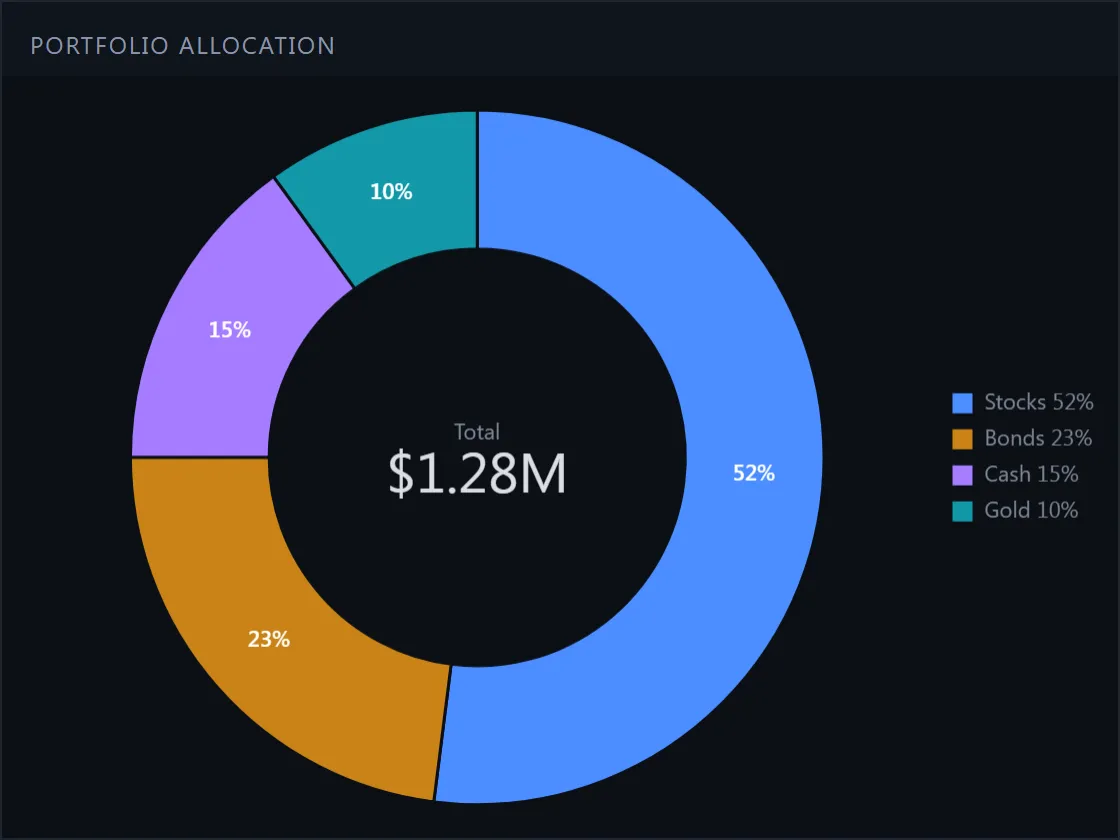
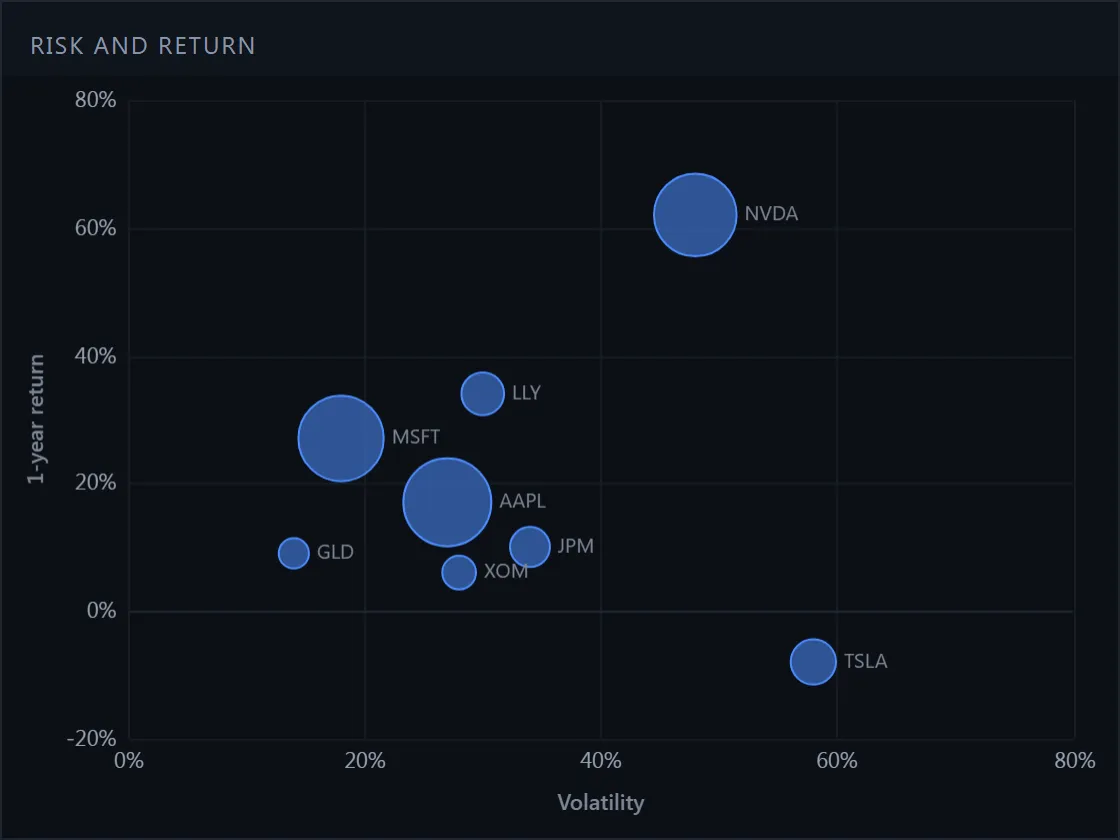
給交易者收盤後閱讀的內容:損益、回撤、配置、風險與報酬。
API: WaterfallChart