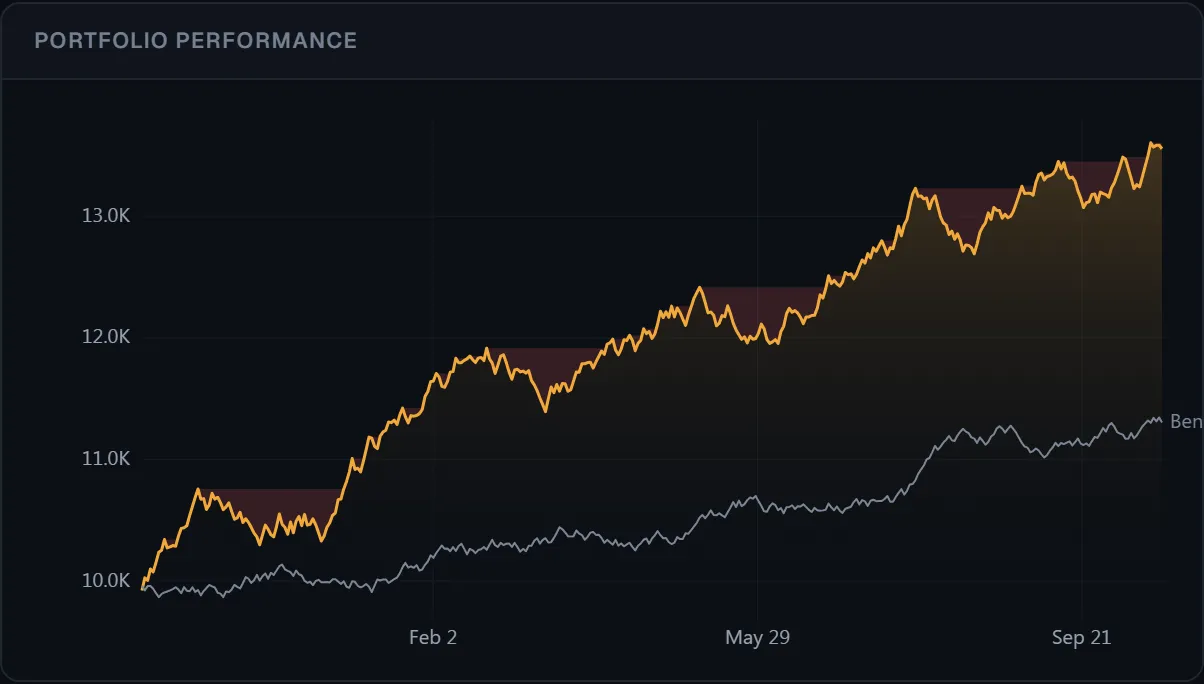
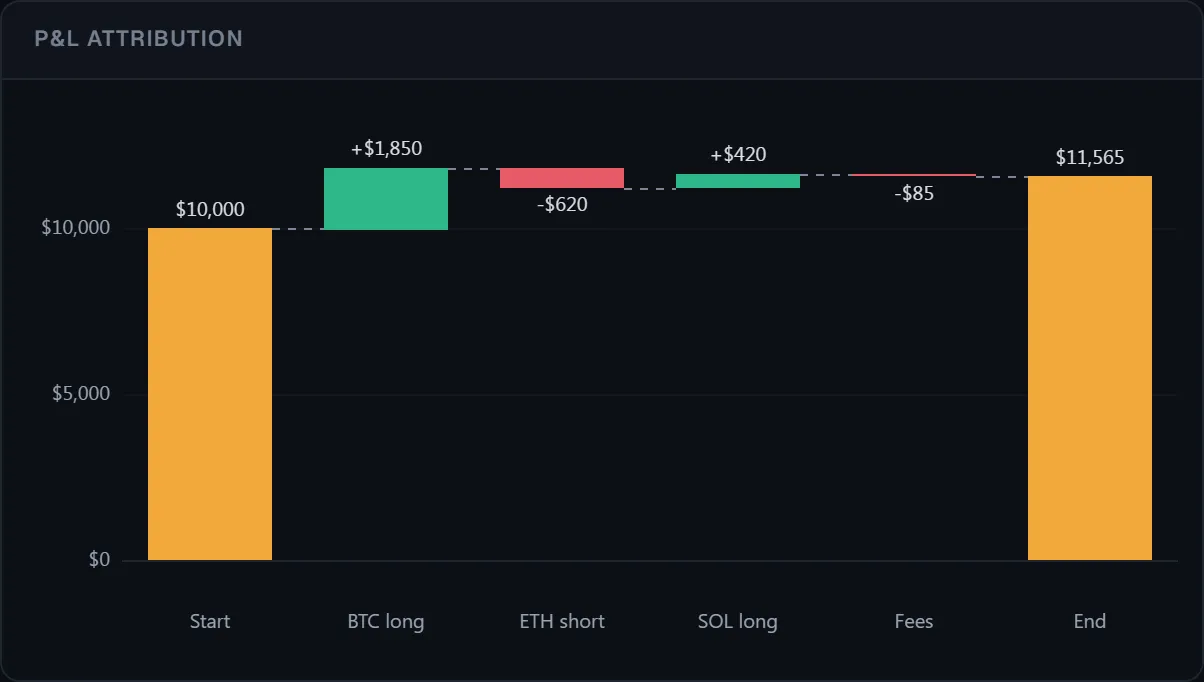
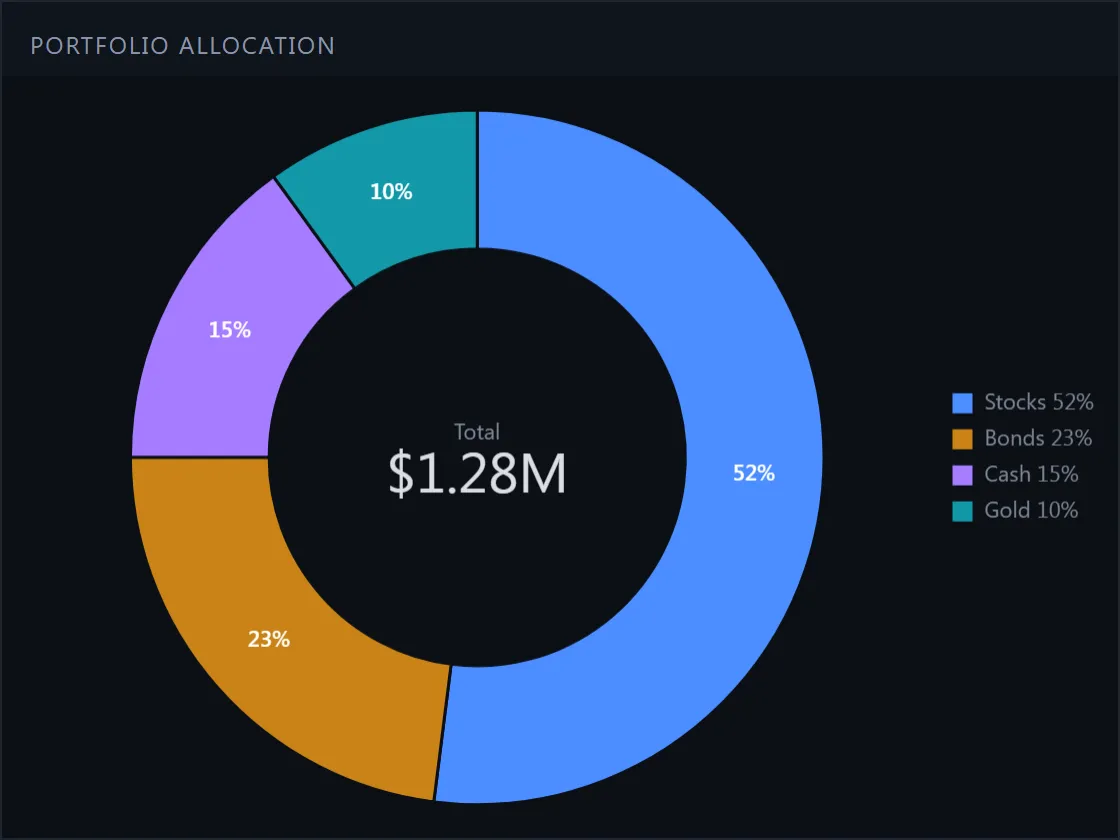
演示/投资组合与报表收益分布直方图代码阅读文档 →import { HistogramChart } from '@tradecanvas/chart' new HistogramChart(el, { values: dailyReturns, binWidth: 0.5, colorBySign: true, theme: 'dark', })● 模拟行情数据,在你的浏览器中生成供交易者收盘后查看:盈亏、回撤、配置、风险与收益。API: HistogramChart← 上一个演示相关矩阵下一个演示 →各时段净流入本部分的更多内容权益曲线与回撤每日盈亏日历盈亏瀑布图资产配置