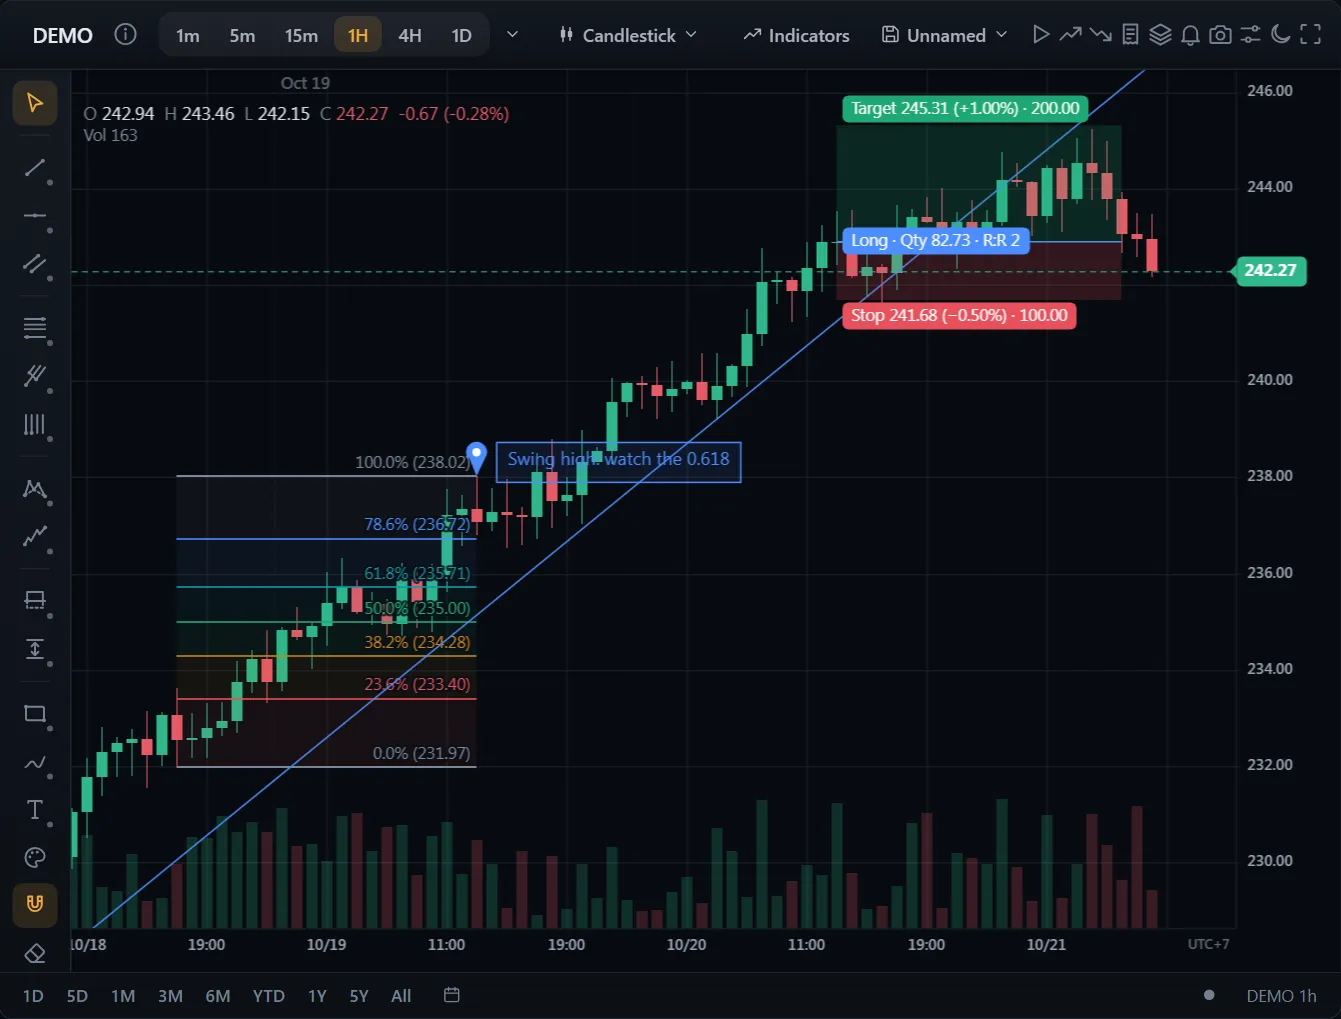
图表上的订单和持仓
代码
阅读文档 →import { ChartWidget } from '@tradecanvas/chart/widget'
// feed: your DataAdapter (a WebSocketAdapter, or your own class)
const widget = new ChartWidget(document.getElementById('chart')!, {
symbol: 'AAPL',
timeframe: '5m',
theme: 'dark',
adapter: feed,
trading: true, // order ticket, orders and positions on the chart
})
// Each order from the ticket, the chart or the ladder reaches you here.
widget.getChart().on('orderPlace', (order) => broker.place(order))● 模拟行情数据,在你的浏览器中生成
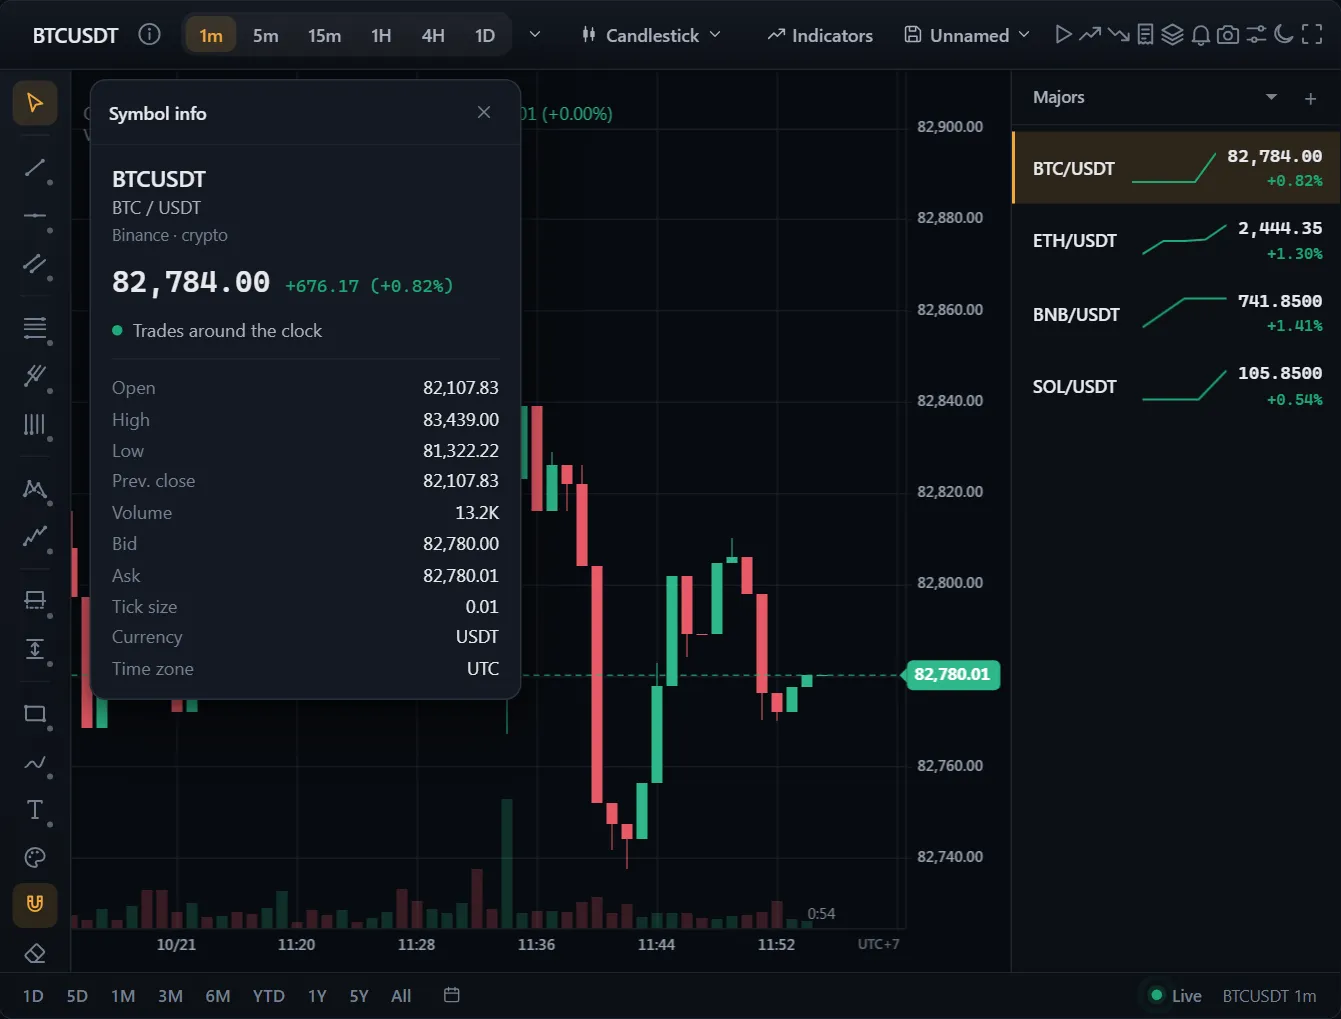
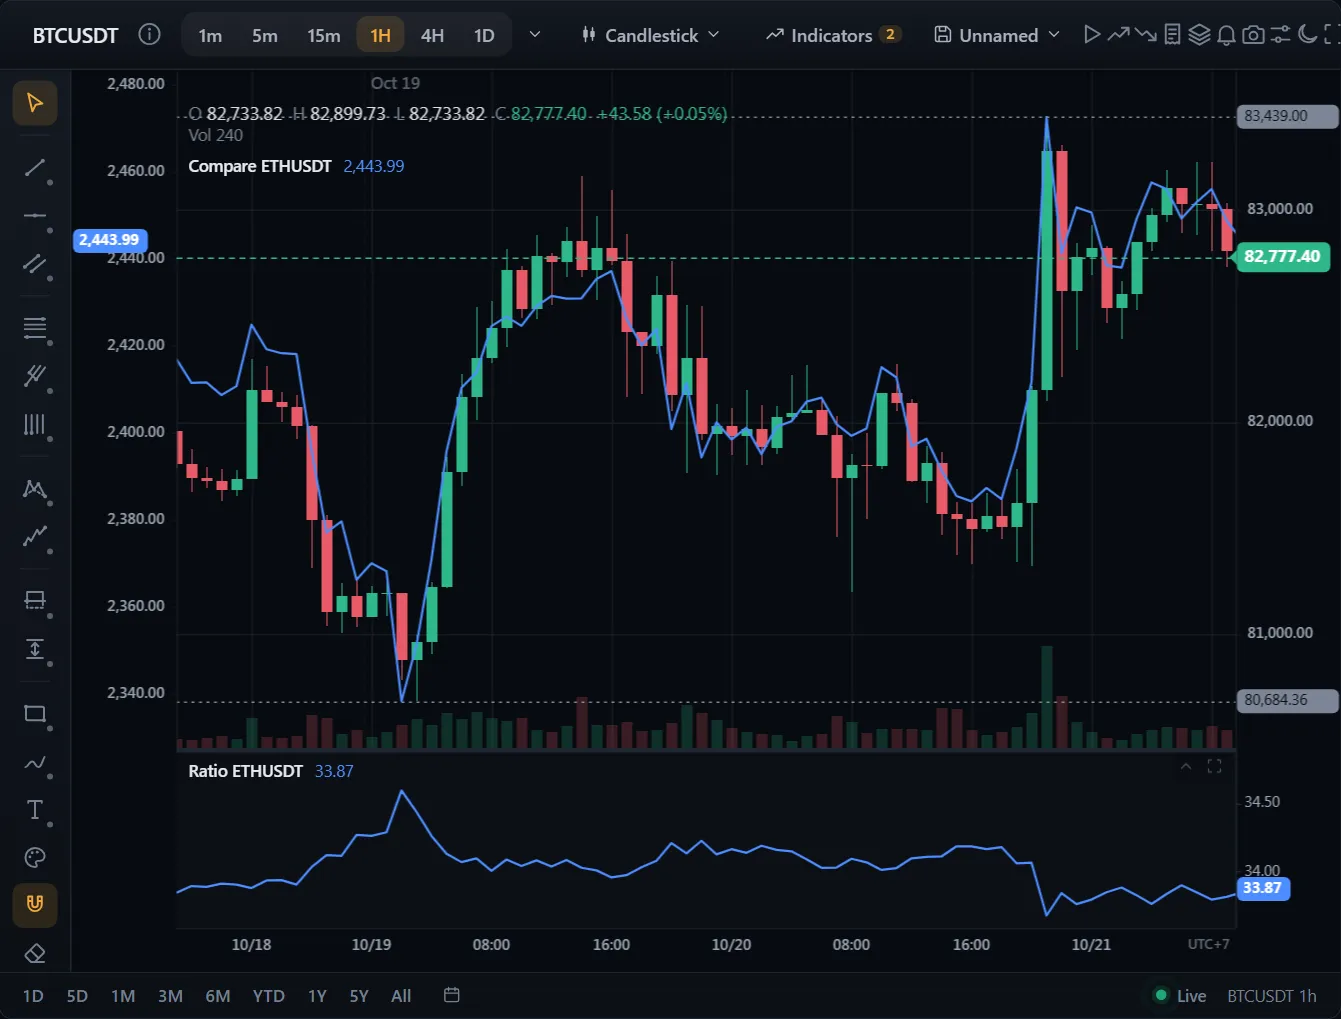
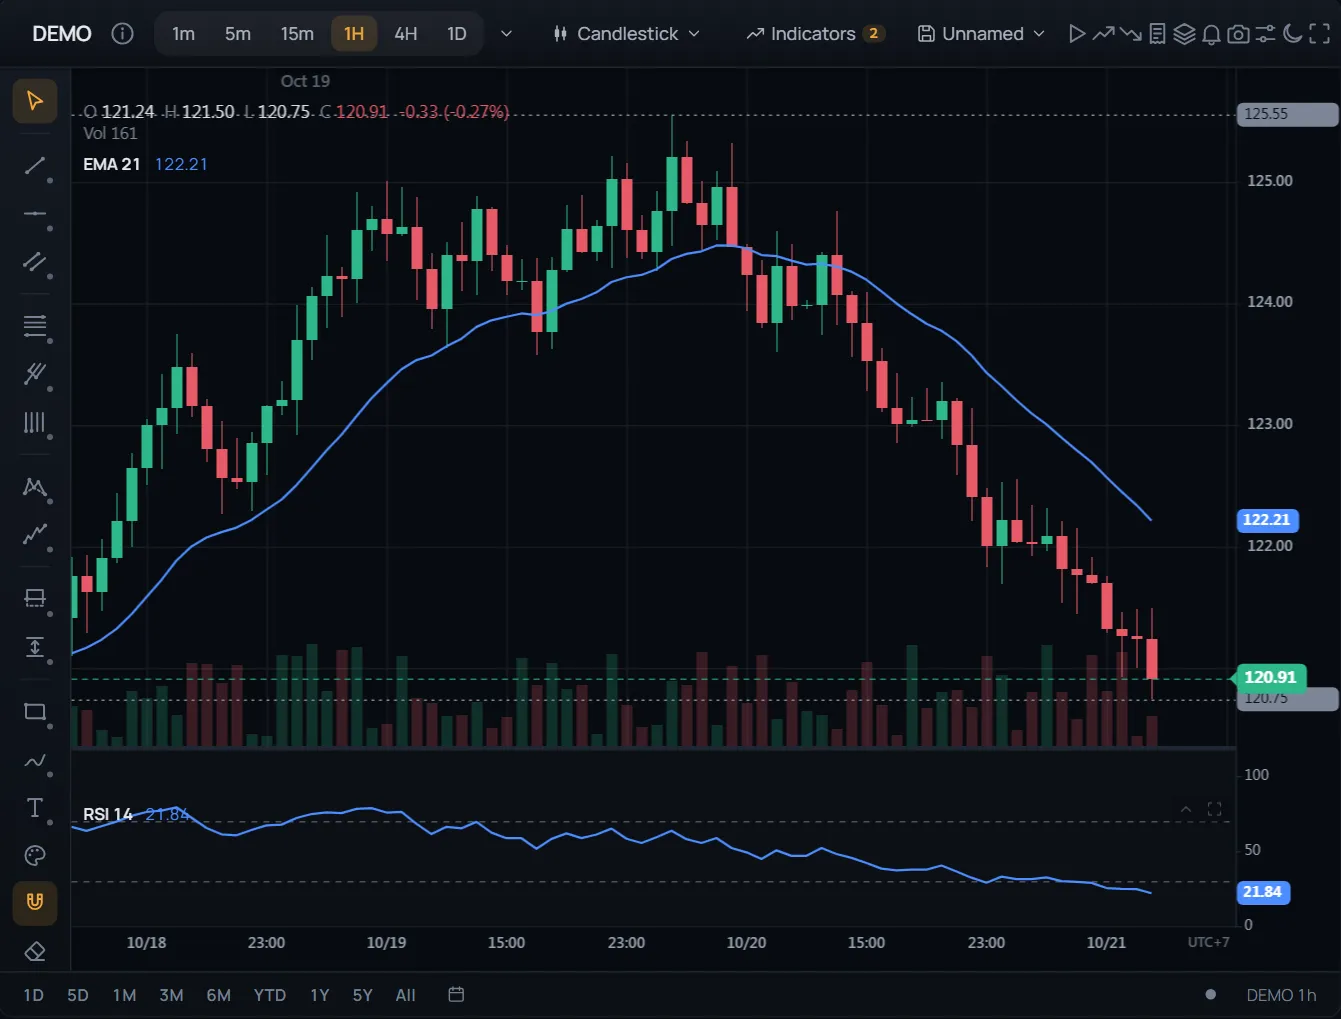
开箱即用的完整界面:下单面板、图表上的订单和持仓、可拖动的止损和止盈、自选列表、警报和K线回放。
限价单、止损单和括号单显示在价格轴上。拖动价格线即可修改。
API: ChartWidget