Ordens e posições no gráfico
Código
Ler a documentação →import { ChartWidget } from '@tradecanvas/chart/widget'
// feed: your DataAdapter (a WebSocketAdapter, or your own class)
const widget = new ChartWidget(document.getElementById('chart')!, {
symbol: 'AAPL',
timeframe: '5m',
theme: 'dark',
adapter: feed,
trading: true, // order ticket, orders and positions on the chart
})
// Each order from the ticket, the chart or the ladder reaches you here.
widget.getChart().on('orderPlace', (order) => broker.place(order))● Dados de mercado simulados, gerados no seu navegador
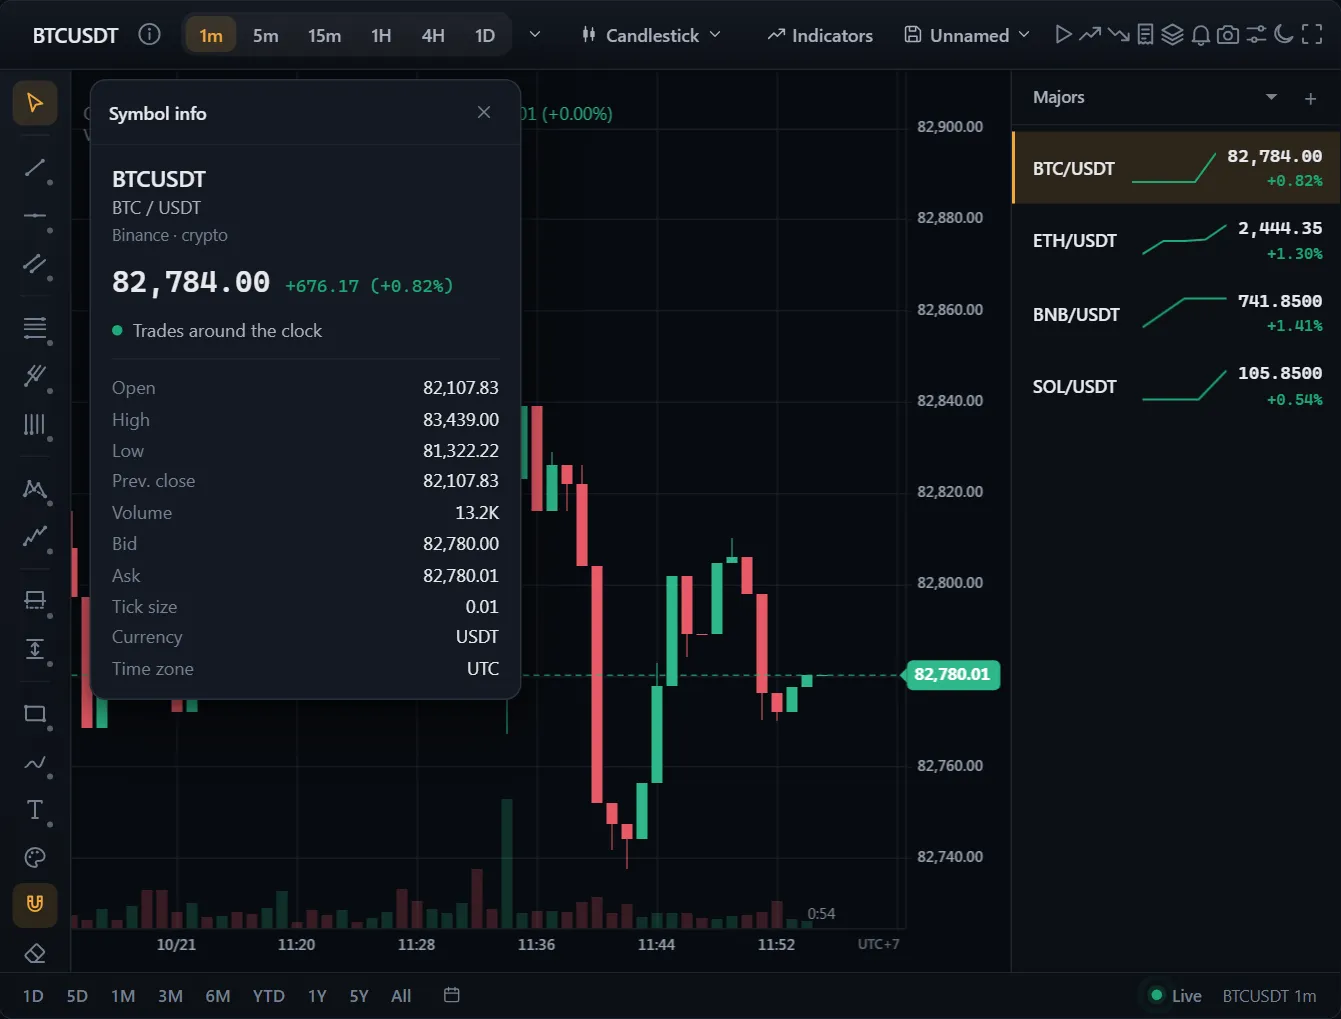
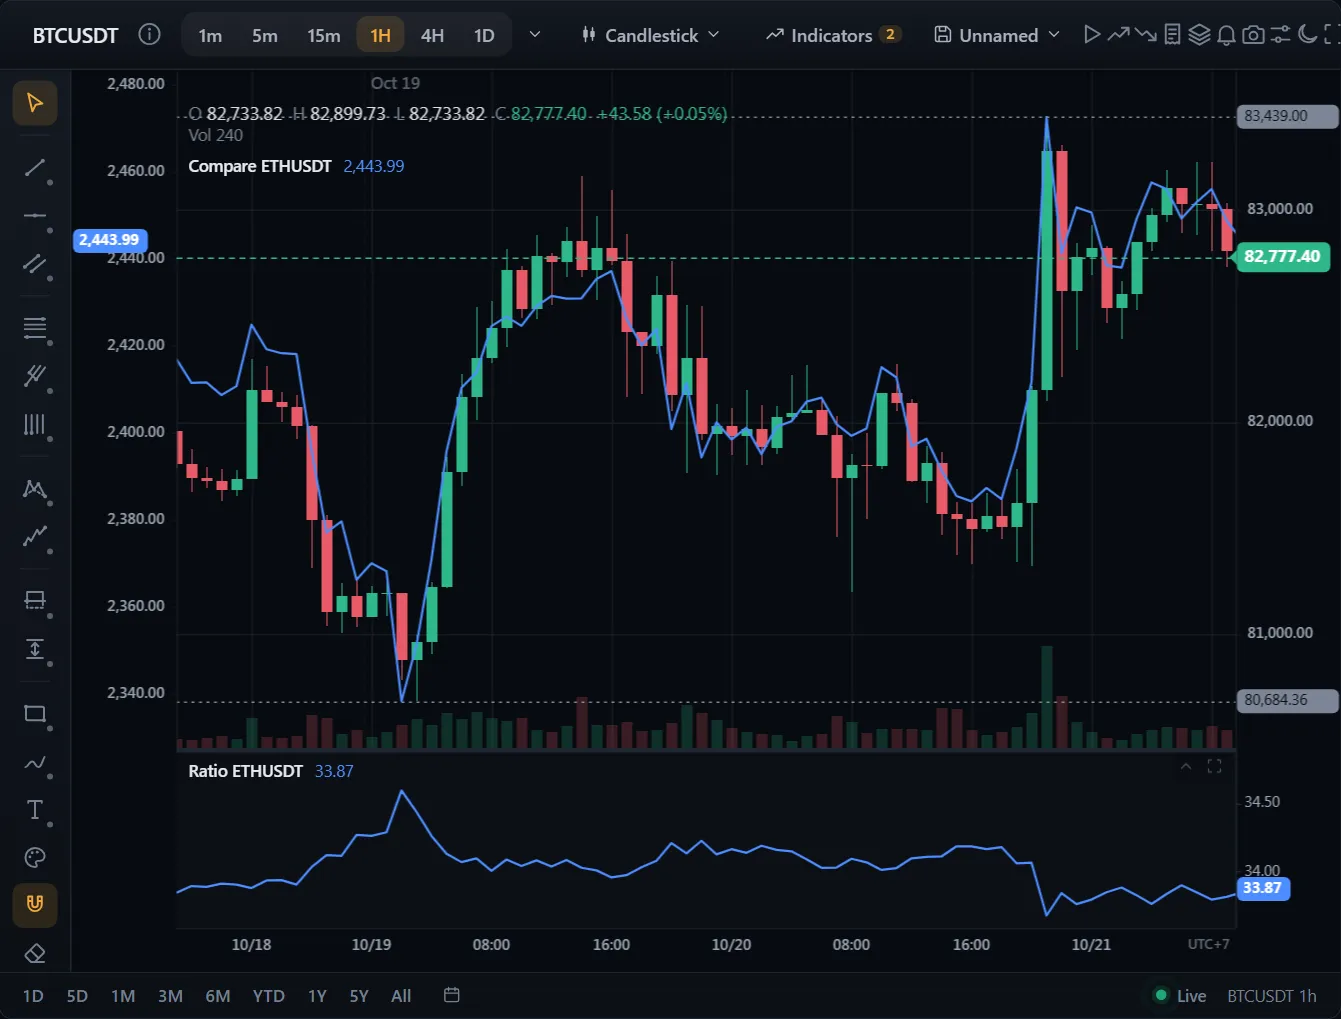
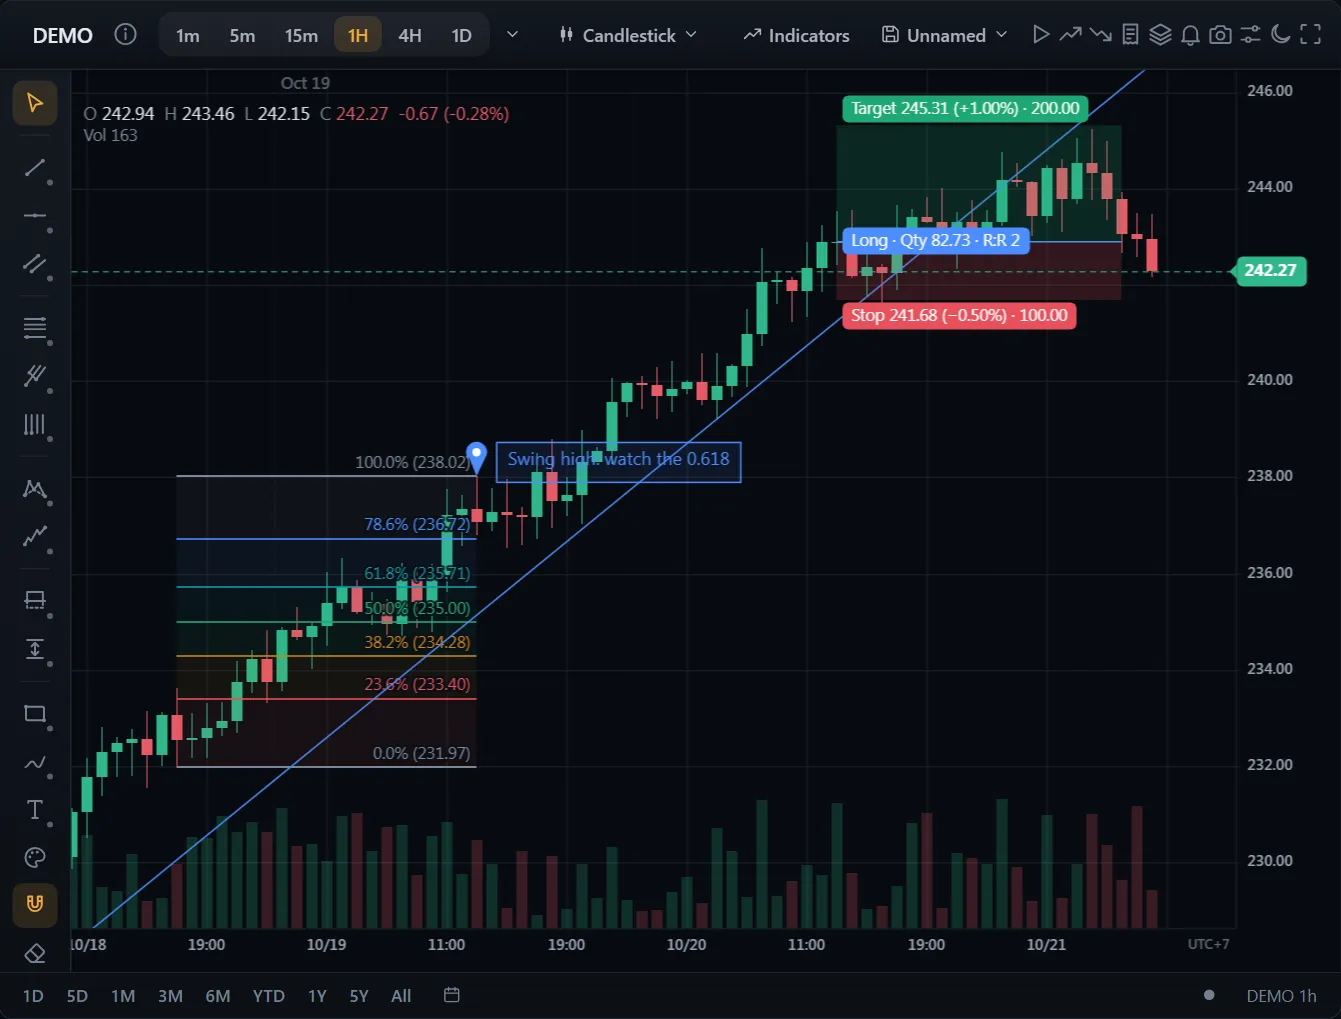
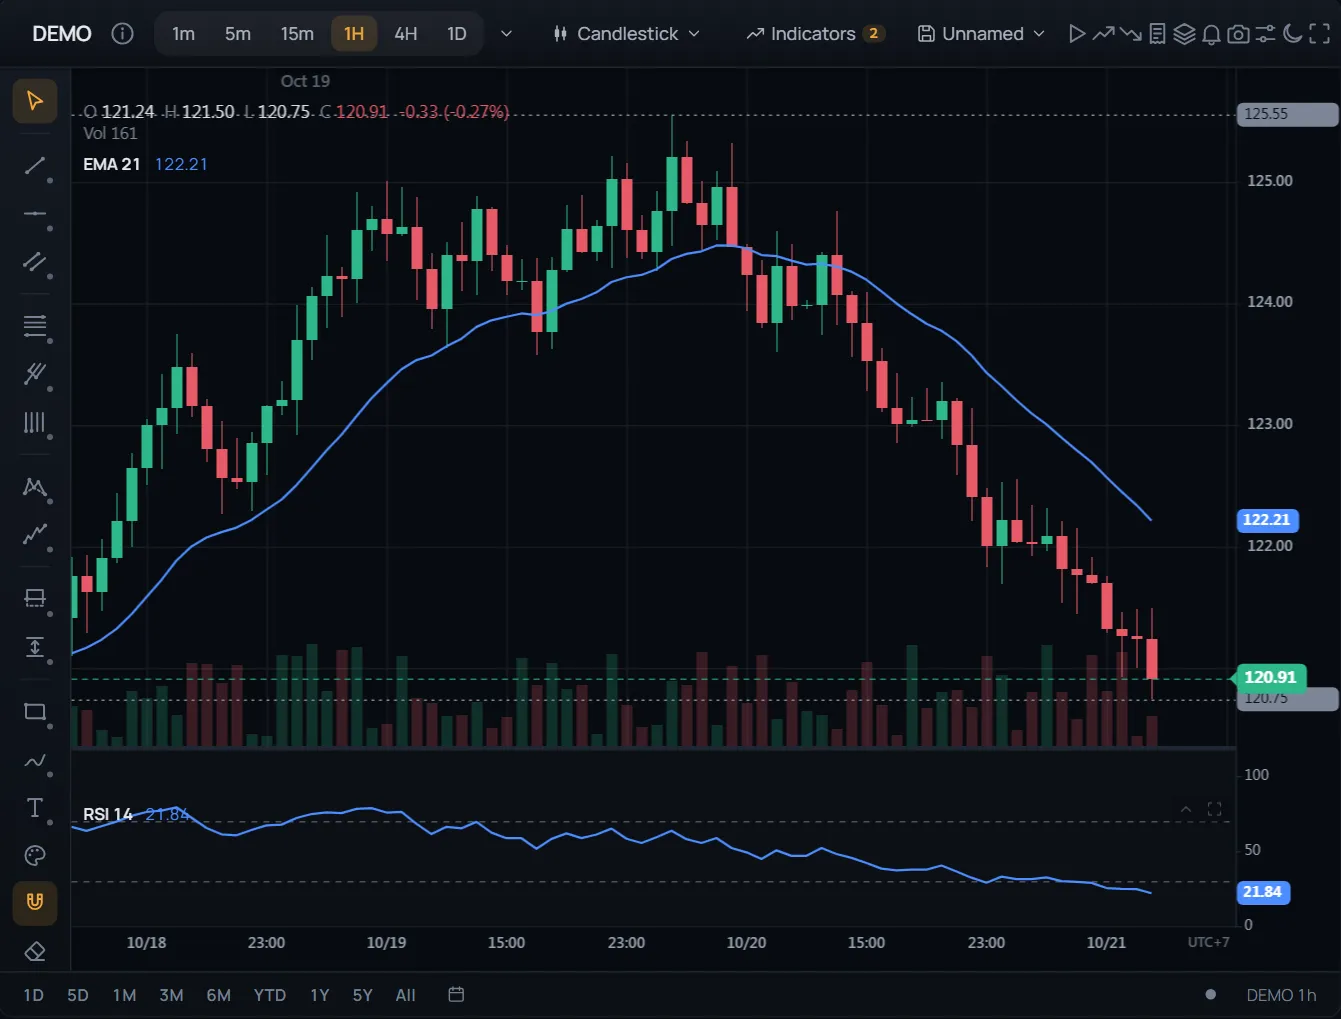
Uma tela completa pronta para usar: boleta, ordens e posições no gráfico, stop-loss e take-profit que você arrasta, listas de observação, alertas e replay de barras.
Ordens limitadas, stop e bracket ficam no eixo de preço. Arraste uma linha para modificá-la.
API: ChartWidget