Risco e retorno
Código
Ler a documentação →import { ScatterChart } from '@tradecanvas/chart'
new ScatterChart(el, {
series: [{ name: 'Holdings', points }], // { label, x, y, size }
xLabel: 'Volatility',
yLabel: '1-year return',
showLabels: true,
theme: 'dark',
})● Dados de mercado simulados, gerados no seu navegador
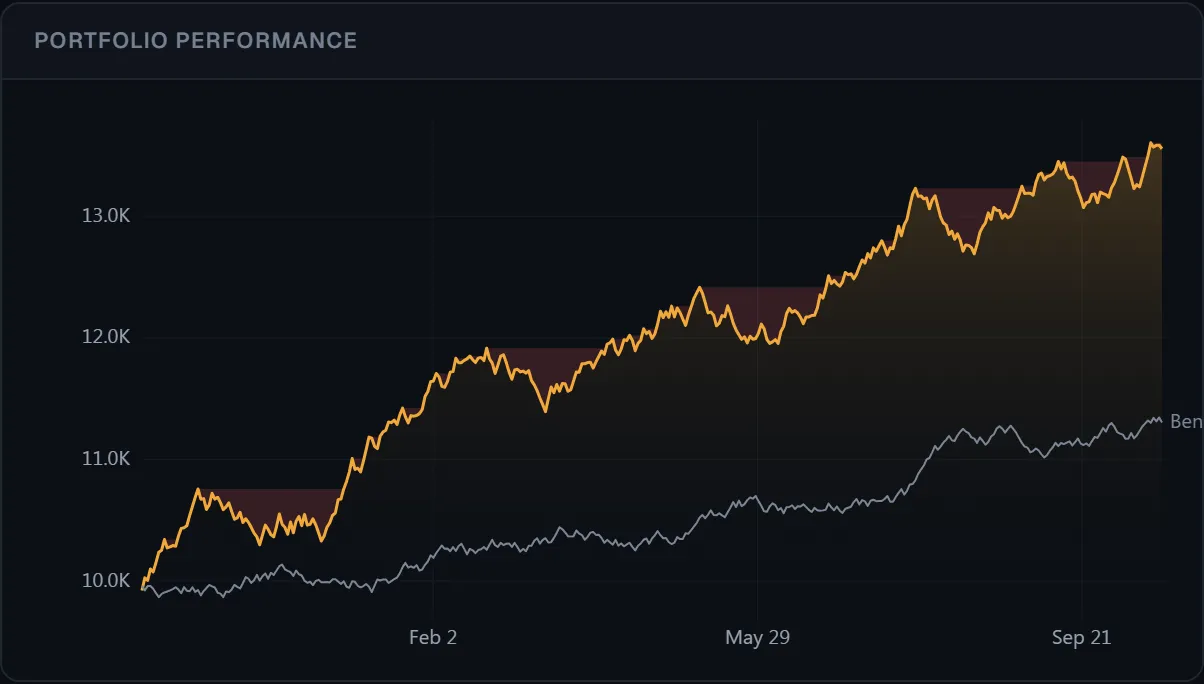
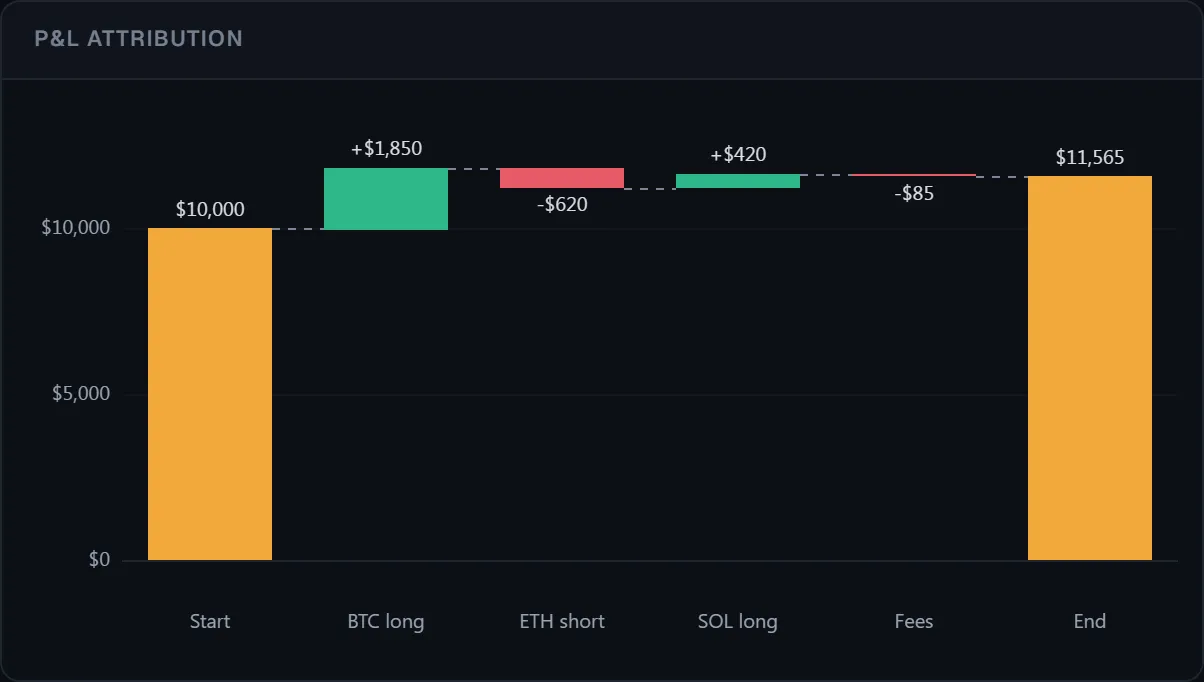
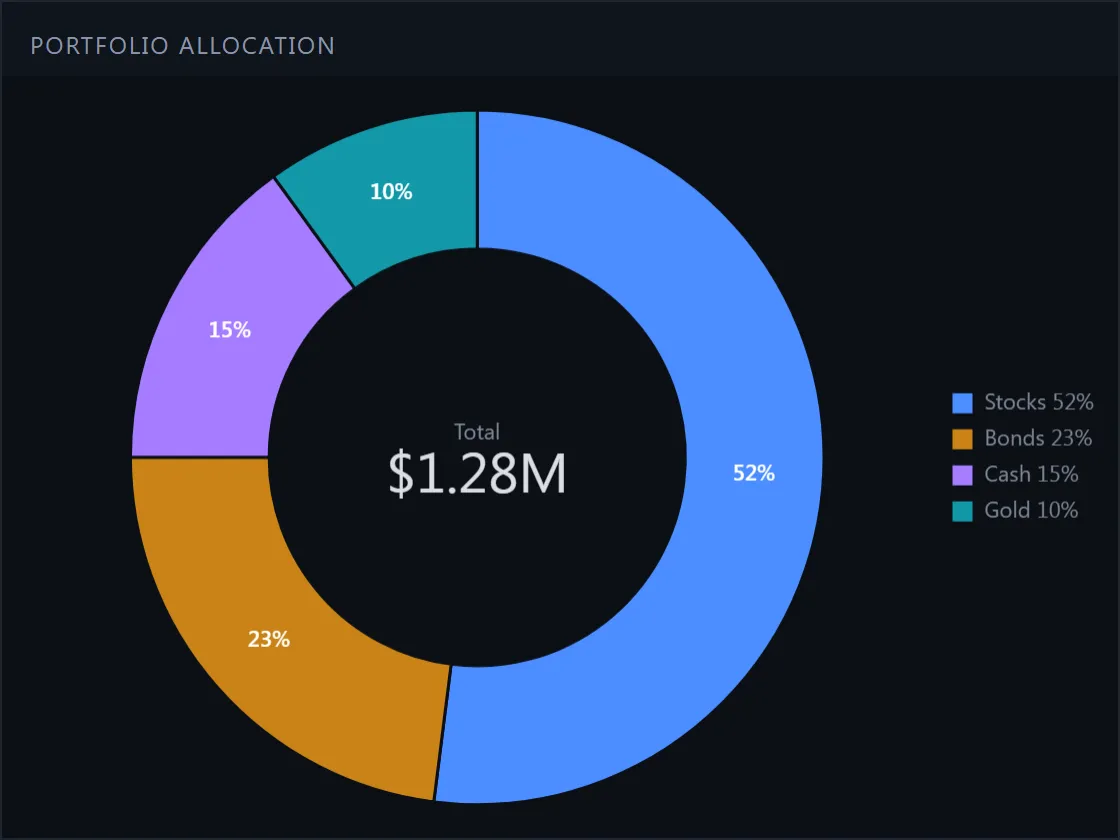
Para o que um trader lê depois do fechamento: P&L, drawdown, alocação, risco e retorno.
API: ScatterChart