Korea's market (KRX)
Code
Read the docs →import { ChartWidget } from '@tradecanvas/chart/widget'
import { MARKET_KRX } from '@tradecanvas/chart'
const widget = new ChartWidget(document.getElementById('chart')!, {
symbol: '005930', // Samsung Electronics on KOSPI
timeframe: '1h',
theme: 'dark',
adapter: feed,
trading: true,
chartOptions: { numberLocale: 'ko-KR' }, // volumes in 만 and 억
})
const chart = widget.getChart()
// Won steps by price band, red up and blue down, ±30% limits rounded as KRX rounds them
chart.setMarket(MARKET_KRX)
// previousClose: yesterday's close, from your feed
chart.setPriceLimits(previousClose) // the day's ceiling and floor on the price axis● Simulated market data, generated in your browser
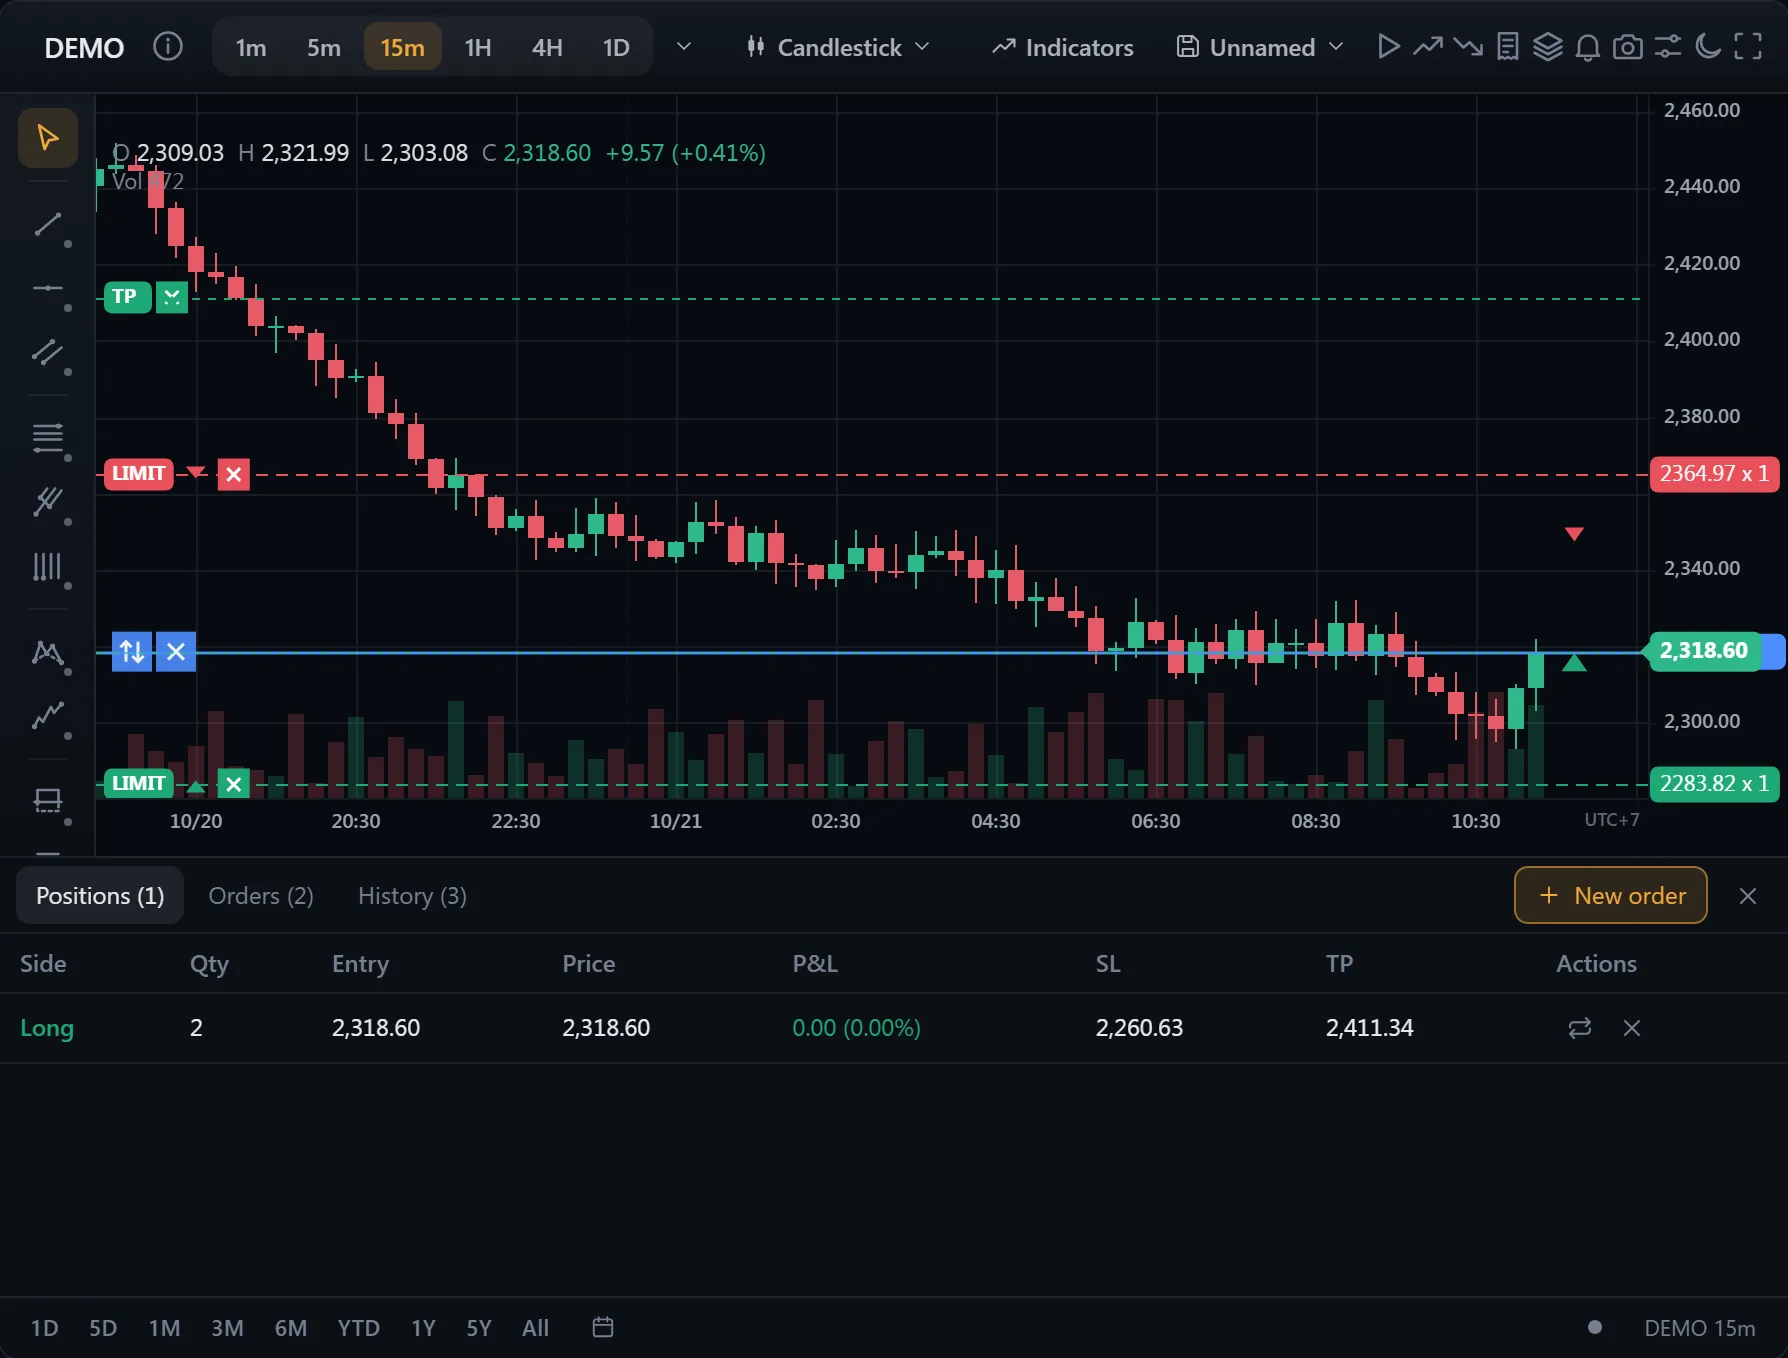
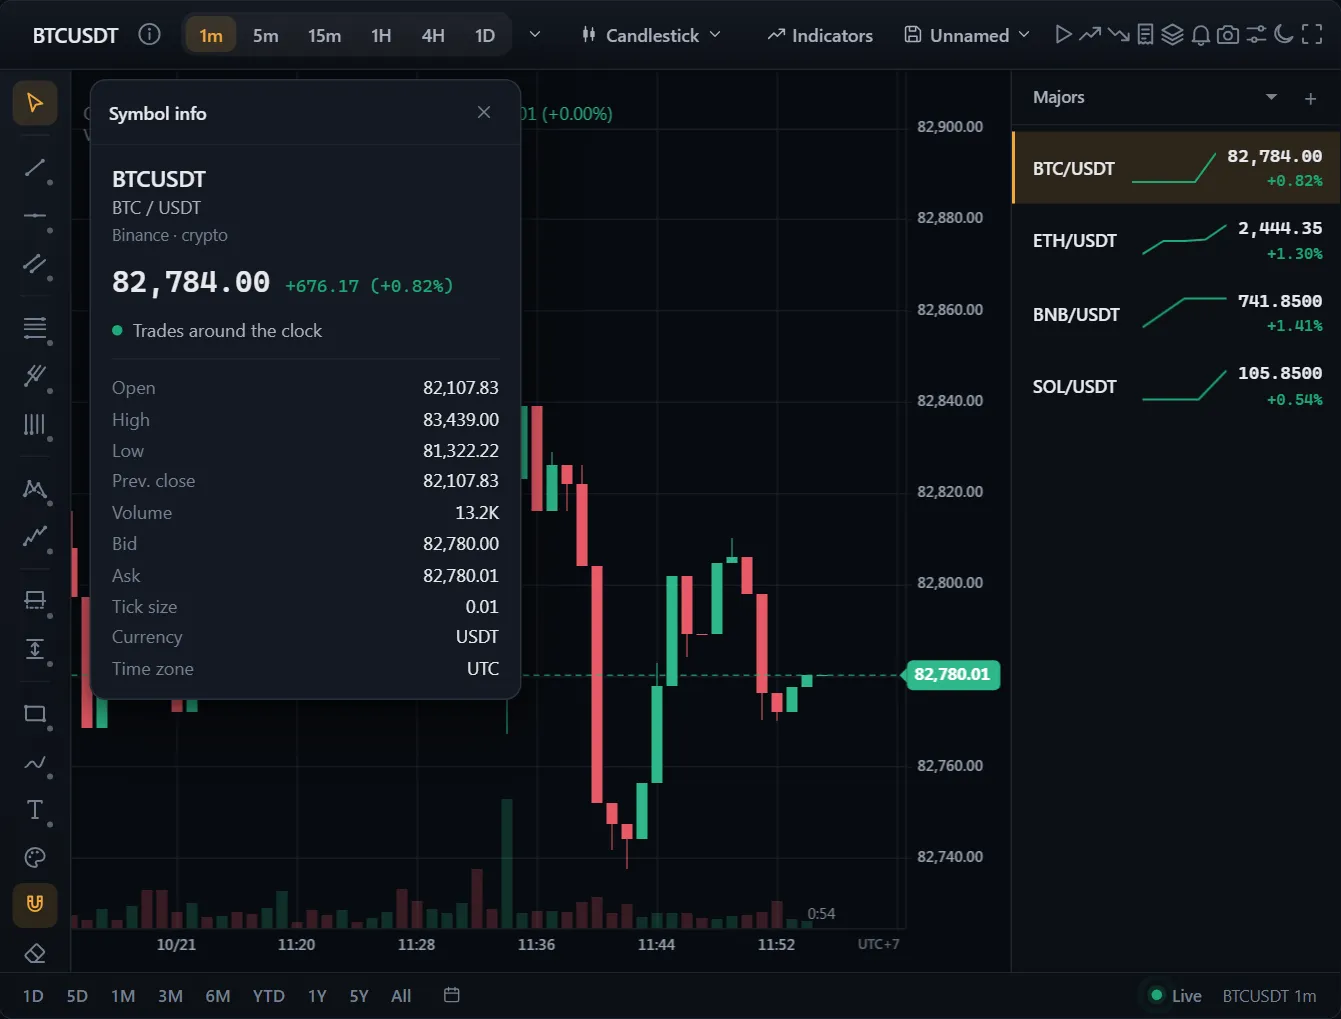
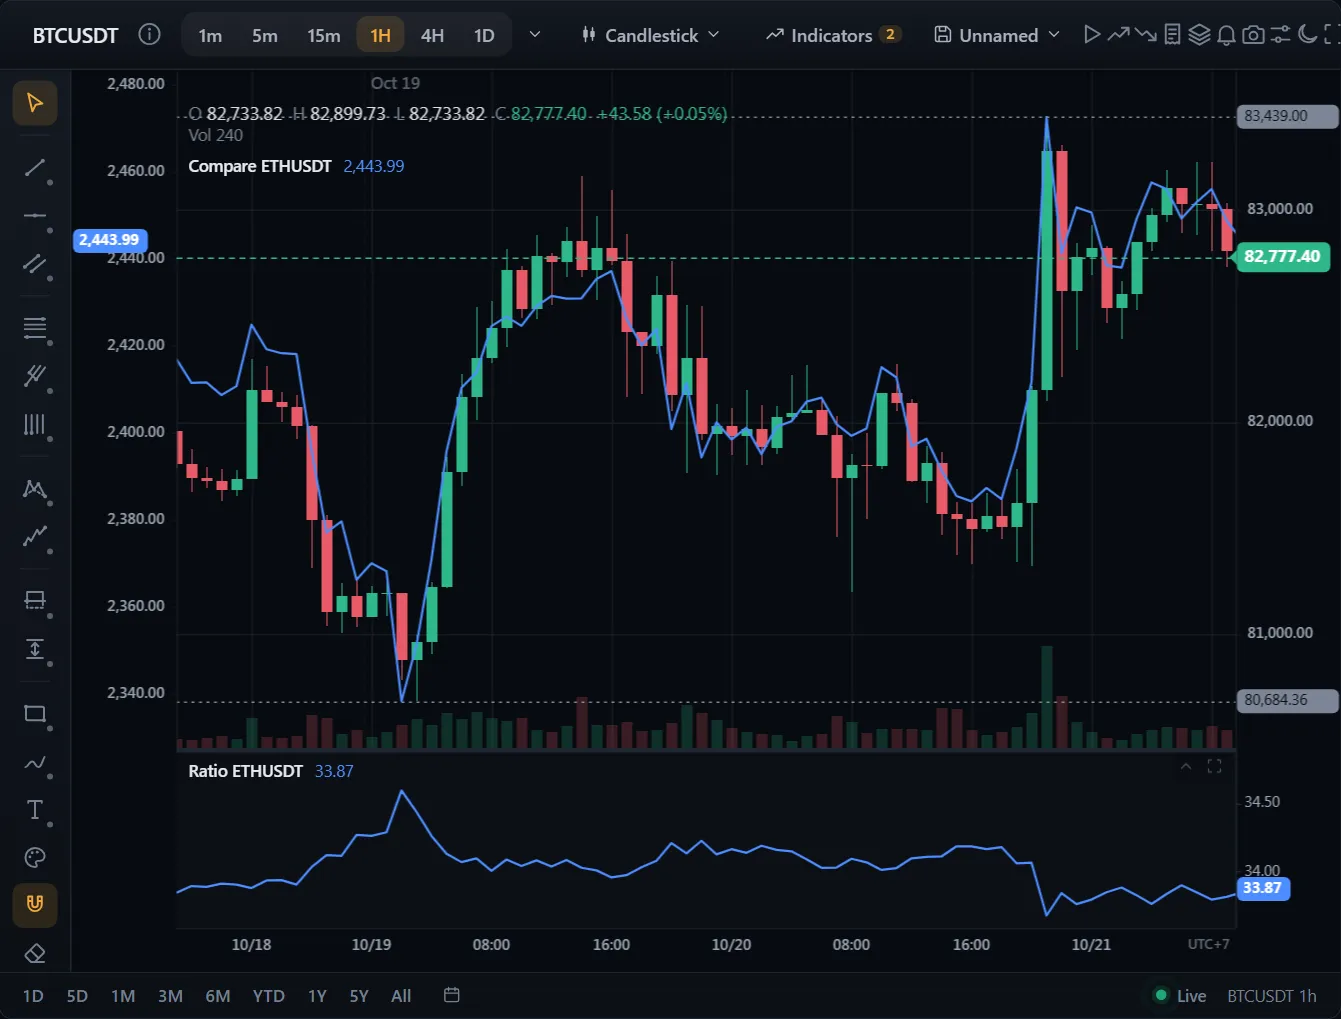
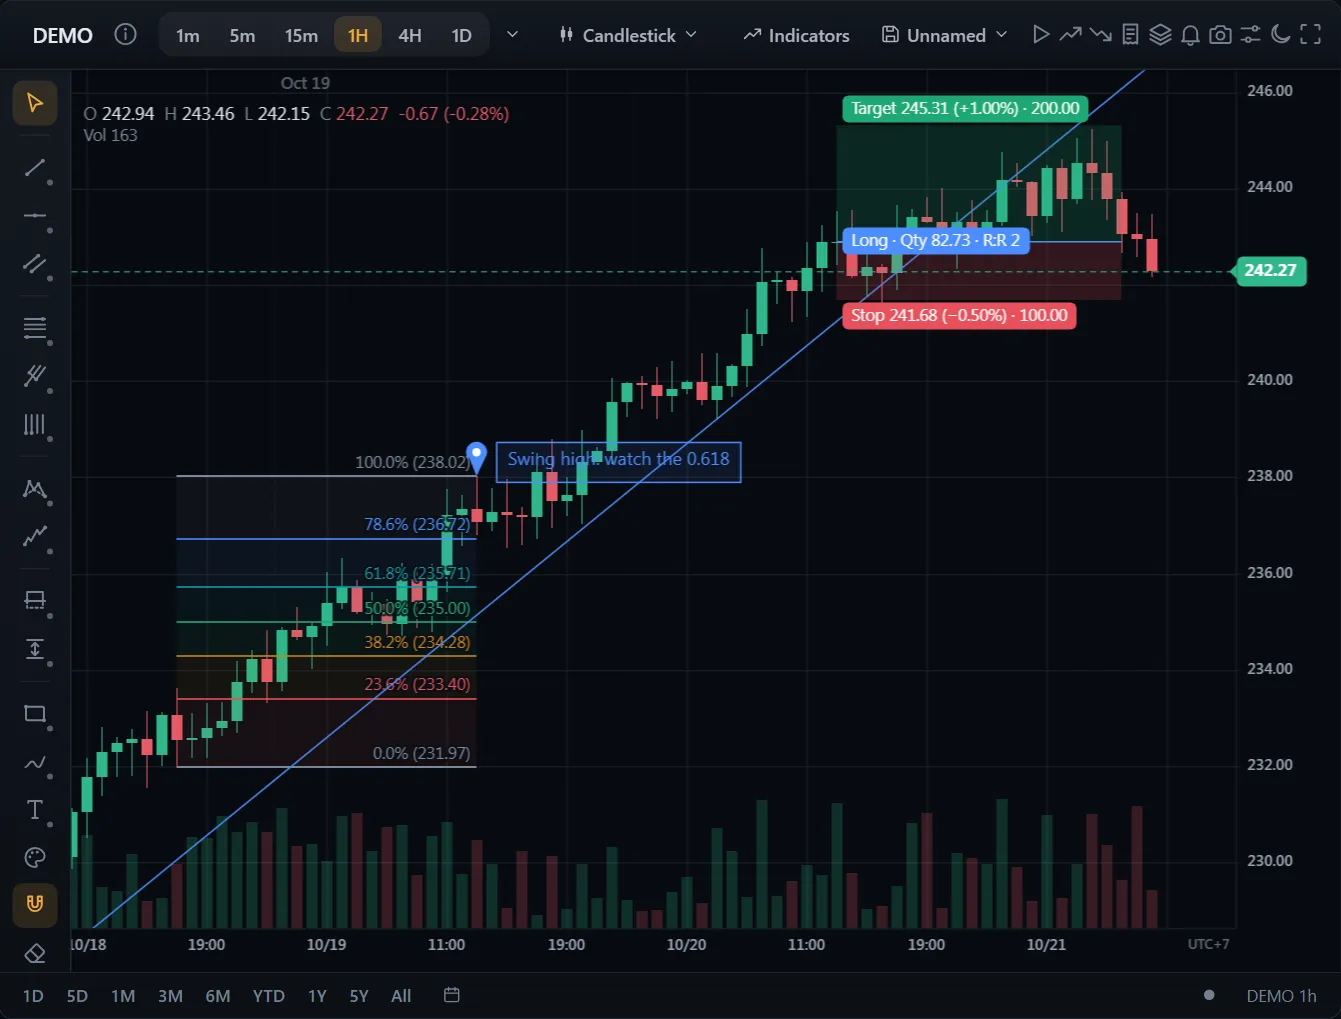
A complete screen out of the box: order ticket, orders and positions on the chart, stop-loss and take-profit you drag, watchlists, alerts and bar replay.
Won steps by price band, rising candles red and falling ones blue, and the day's ±30% limits from the reference price, rounded as KRX rounds them.
API: MARKET_KRX