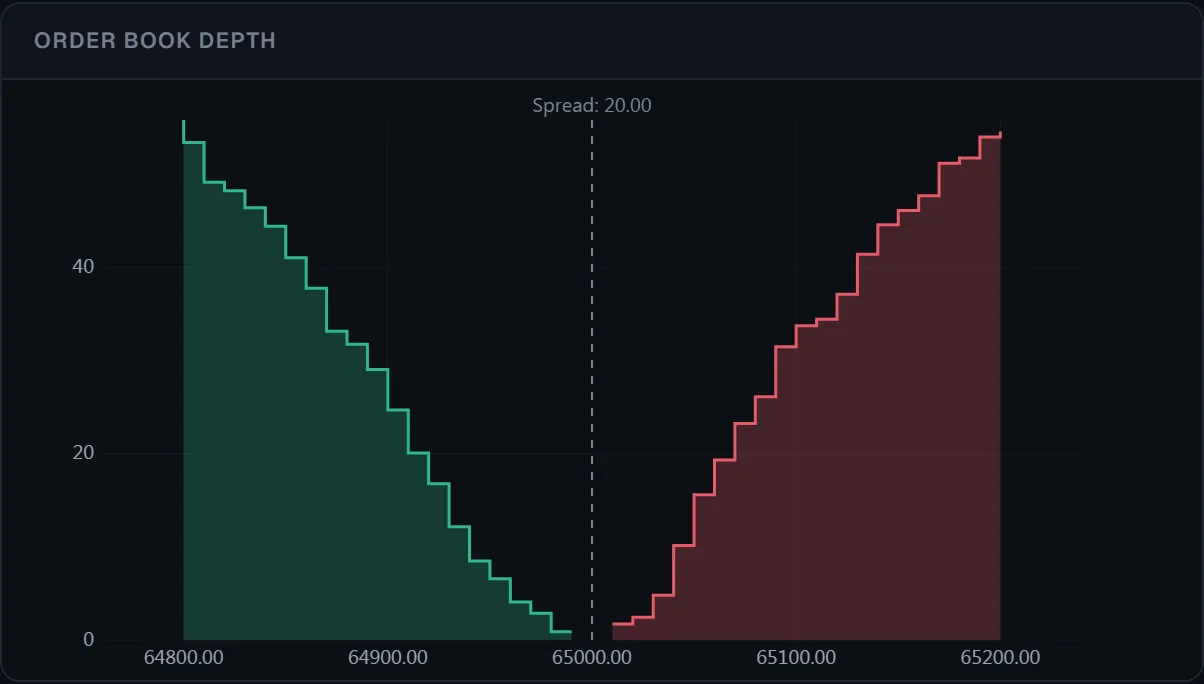
Heatmap de liquidité
Code
Lire la doc →import { Chart } from '@tradecanvas/chart'
const chart = new Chart(el, { theme: 'dark', renderer: 'webgl' })
chart.setData(bars)
chart.setDepthHeatmapVisible(true)
// Each order-book snapshot becomes a column of the heatmap behind the price
chart.pushDepthSnapshot(book, Date.now())● Données de marché simulées, générées dans votre navigateur
Voyez le carnet, pas seulement le dernier cours : profondeur, heatmap de liquidité sur le GPU, échelle de profondeur où l’on trade d’un clic et profil de volume.
API: pushDepthSnapshot