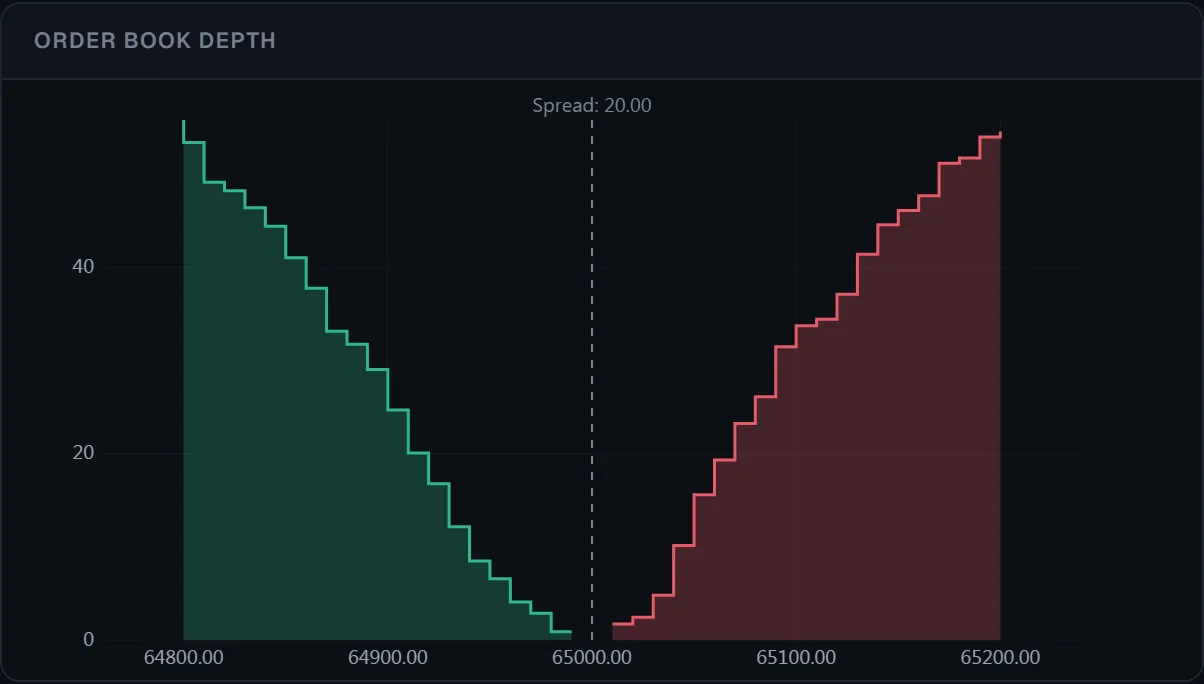
Likidite ısı haritası
import { Chart } from '@tradecanvas/chart'

const chart = new Chart(el, { theme: 'dark', renderer: 'webgl' })
chart.setData(bars)
chart.setDepthHeatmapVisible(true)
// Each order-book snapshot becomes a column of the heatmap behind the price
chart.pushDepthSnapshot(book, Date.now())
● Simüle edilmiş piyasa verisi, tarayıcınızda üretilir
Yalnızca son fiyatı değil, defteri görün: derinlik, GPU’da likidite ısı haritası, tıklayarak işlem yapılan bir merdiven ve hacim profili.
API: pushDepthSnapshot