インジケーター
134 種類の組み込みインジケーターがあります。id を指定して追加します。省略したパラメーターは 既定値になり、無効な値も既定値に戻ります。
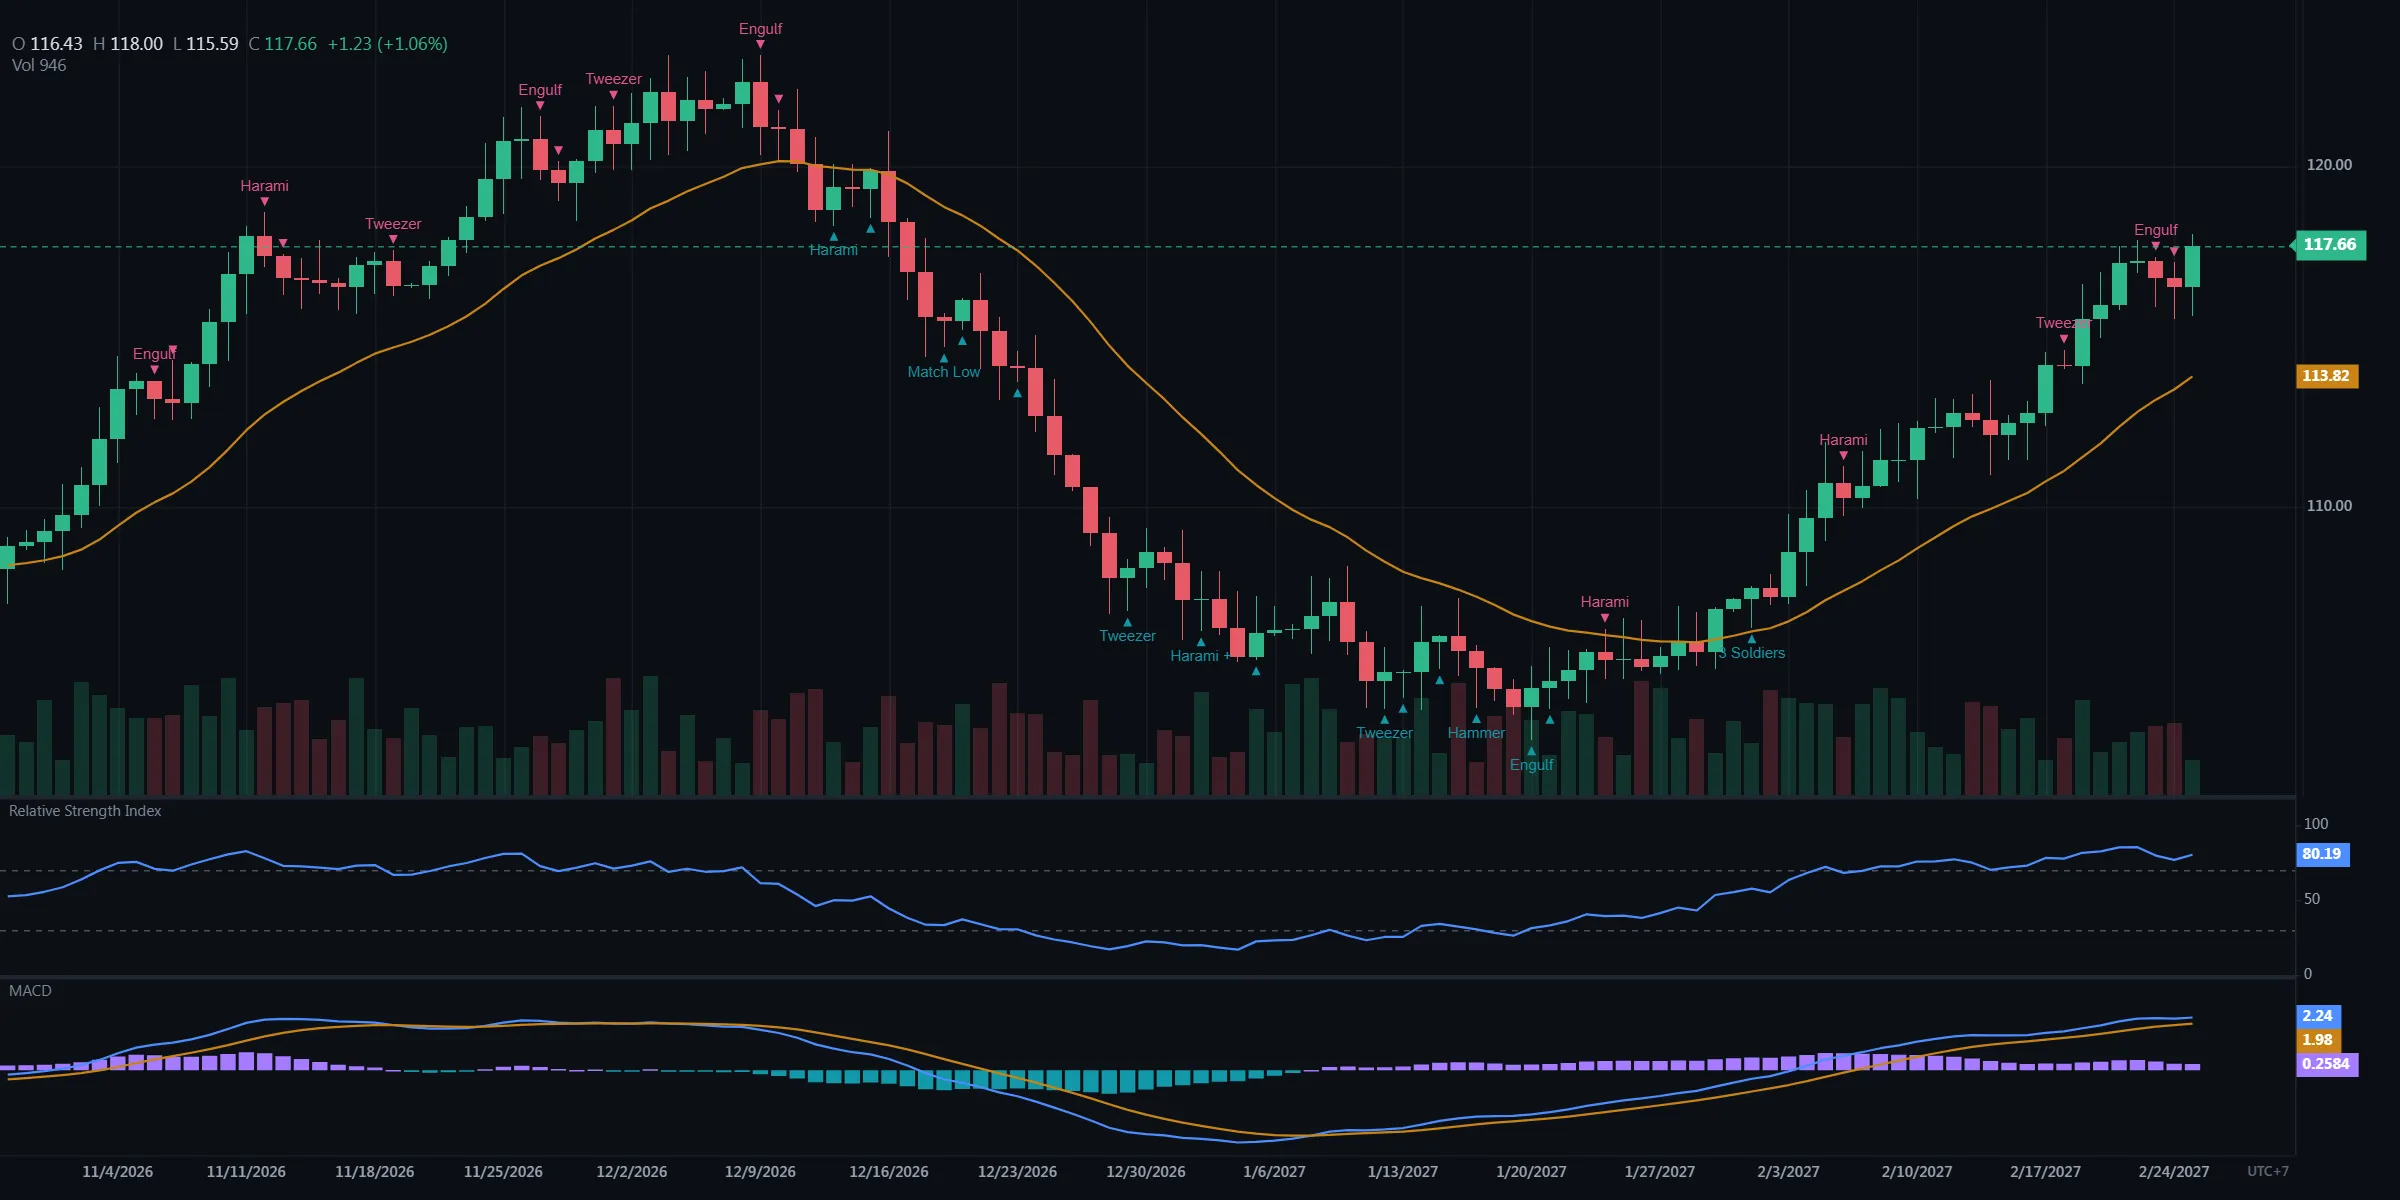 ● デモローソク足パターンと指標ペインブラウザー内で生成したシミュレーション市場データ
インジケーターの追加
const ema = chart.addIndicator('ema', { period: 50 })          // on the price pane
const rsi = chart.addIndicator('rsi', { period: 14 }, 'bottom') // in a pane of its own
chart.updateIndicator(rsi, { period: 21 })
chart.removeIndicator(rsi)
addIndicator はインスタンス id を返します。同じインジケーターを何度でも追加でき、
インスタンスごとに独自の入力、色、レベルを持てます。
ソースとインジケーターへの適用
下の表で ソース と記されたインジケーターは、終値以外の価格
(open、high、low、hl2、hlc3、 ohlc4、hlcc4)や、別のインジケーターのラインに対して計算できます。
RSI の移動平均は RSI のペインに RSI のスケールで描かれ、RSI を削除すると一緒に消えます。
import { indicatorSource } from '@tradecanvas/chart'

chart.updateIndicator(ema, { source: 'hlc3' })
const smoothed = chart.addIndicator('sma', { period: 9, source: indicatorSource(rsi, 'value') })
ペインのインジケーター同士で 1 つのペインを共有することもできます: chart.addIndicator('stochastic', {}, 'bottom', { pane: rsi })。
レベル、色、値
chart.setIndicatorLevels(rsi, [20, 50, 80])   // null restores 30 / 70
chart.updateIndicatorStyle(rsi, { colors: ['#f2a93b'], lineWidths: [2] })
chart.setIndicatorVisible(rsi, false)

const series = chart.getIndicatorOutput(rsi)?.series ?? []
const latest = series[series.length - 1]?.value   // keyed by the line keys below
各ラインの最新値は、そのラインの色で軸上にタグ表示されます。タグは features.indicatorValueLabels: false または setIndicatorValueLabelsVisible(false) で
非表示にできます。ペインのライン、レベル、軸、クロスヘアは 1 つのスケールを共有します。
価格ペインに表示 (48)
| id | 名前 | 既定のパラメーター | ライン |
|---|---|---|---|
sma | Simple Moving Average· ソース | period: 20, source: "close" | SMA |
ema | Exponential Moving Average· ソース | period: 20, source: "close" | EMA |
bb | Bollinger Bands· ソース | period: 20, stdDev: 2, source: "close" | Upper, Basis, Lower |
vwap | Volume Weighted Average Price | — | VWAP |
ichimoku | Ichimoku Cloud | tenkan: 9, kijun: 26, senkou: 52, displacement: 26 | Conversion, Base, Lead A, Lead B |
psar | Parabolic SAR | step: 0.02, max: 0.2 | SAR |
supertrend | Supertrend | period: 10, multiplier: 3 | Supertrend |
keltner | Keltner Channel | emaPeriod: 20, atrPeriod: 10, multiplier: 1.5 | Upper, Basis, Lower |
donchian | Donchian Channel | period: 20 | Upper, Basis, Lower |
pivots | Pivot Points | lookback: 24, type: "traditional" | R3, R2, R1, P, S1, S2, S3 |
avwap | Anchored VWAP | anchorTime: 0 | AVWAP |
zigzag | ZigZag | deviation: 5 | Pivot |
lrc | Linear Regression Channel· ソース | period: 100, stdDev: 2, source: "close" | Upper, Basis, Lower |
hma | Hull Moving Average· ソース | period: 21, source: "close" | HMA |
mtfma | MTF Moving Average· ソース | period: 50, timeframe: "1d", source: "close" | MA |
svwap | Session VWAP | bands: 1 | VWAP, +1σ, −1σ, +2σ, −2σ, +3σ, −3σ |
chandelier | Chandelier Exit | period: 22, multiplier: 3 | Long, Short |
alligator | Alligator | jaw: 13, teeth: 8, lips: 5, jawShift: 8, teethShift: 5, lipsShift: 3 | Jaw, Teeth, Lips |
vwma | Volume Weighted Moving Average· ソース | period: 20, source: "close" | VWMA |
wma | Weighted Moving Average· ソース | period: 20, source: "close" | WMA |
envelope | Moving Average Envelope· ソース | period: 20, percent: 2.5, source: "close" | Upper, Basis, Lower |
tema | Triple EMA· ソース | period: 20, source: "close" | TEMA |
volumeProfile | Volume Profile | rows: 24 | — |
dema | Double Exponential Moving Average· ソース | period: 20, source: "close" | DEMA |
smma | Smoothed Moving Average· ソース | period: 14, source: "close" | SMMA |
alma | Arnaud Legoux Moving Average· ソース | period: 9, offset: 0.85, sigma: 6, source: "close" | ALMA |
kama | Kaufman Adaptive Moving Average· ソース | period: 10, fast: 2, slow: 30, source: "close" | KAMA |
lsma | Least Squares Moving Average· ソース | period: 25, offset: 0, source: "close" | LSMA |
mcginley | McGinley Dynamic· ソース | period: 14, source: "close" | McGinley |
macross | MA Cross· ソース | fast: 9, slow: 21, type: "sma", source: "close" | Fast, Slow |
fractals | Williams Fractals | period: 2 | Up, Down |
cks | Chande Kroll Stop | p: 10, x: 1, q: 9 | Stop Long, Stop Short |
seb | Standard Error Bands | period: 21, mult: 2, smooth: 3 | Upper, Middle, Lower |
gmma | Guppy Multiple Moving Average | — | EMA 3, EMA 5, EMA 8, EMA 10, EMA 12, EMA 15, EMA 30, EMA 35, EMA 40, EMA 45, EMA 50, EMA 60 |
maribbon | Moving Average Ribbon | ma1: 20, ma2: 50, ma3: 100, ma4: 200, exponential: 0 | MA 1, MA 2, MA 3, MA 4 |
avgprice | Average Price | — | Average |
medprice | Median Price | — | Median |
typprice | Typical Price | — | Typical |
machannel | Moving Average Channel | upperLength: 20, lowerLength: 20, upperOffset: 0, lowerOffset: 0 | Upper, Lower |
hamming | Moving Average Hamming· ソース | period: 10, source: "close" | MA |
madouble | Moving Average Double· ソース | first: 20, second: 50, type: "sma", source: "close" | MA 1, MA 2 |
matriple | Moving Average Triple· ソース | first: 10, second: 20, third: 50, type: "sma", source: "close" | MA 1, MA 2, MA 3 |
volindex | Volatility Index | period: 7, mult: 3 | Stop |
tsf | Time Series Forecast | period: 14 | TSF |
wclose | Weighted Close | — | Weighted |
demark | DeMark Projected Range | — | Projected high, Projected low |
rainbow | Moving Average Rainbow | first: 10, step: 10, count: 10, exponential: 0 | MA 1, MA 2, MA 3, MA 4, MA 5, MA 6, MA 7, MA 8, MA 9, MA 10, MA 11, MA 12, MA 13, MA 14, MA 15, MA 16, MA 17, MA 18, MA 19, MA 20 |
candlepatterns | Candlestick Patterns | trendPeriod: 10, reversal: 1, continuation: 1, indecision: 0 | Bullish, Bearish, Indecision |
mtfma は、上位時間足の移動平均を現在のチャートに描きます。たとえば 1 時間足のバーに
日足の 50 MA を表示できます。上位時間足の確定した終値だけを平均するため、境界ごとに
階段状に変化し、リペイントすることはありません。
独自のペインに表示 (86)
| id | 名前 | 既定のパラメーター | ライン | レベル |
|---|---|---|---|---|
rsi | Relative Strength Index· ソース | period: 14, source: "close" | RSI | 30, 70 |
macd | MACD· ソース | fast: 12, slow: 26, signal: 9, source: "close" | Histogram, MACD, Signal | — |
stochastic | Stochastic Oscillator | kPeriod: 14, dPeriod: 3, smooth: 3 | %K, %D | 20, 80 |
atr | Average True Range | period: 14 | ATR | — |
adx | Average Directional Index | period: 14 | ADX, +DI, −DI | — |
obv | On Balance Volume | — | OBV | — |
williamsR | Williams %R | period: 14 | %R | -80, -20 |
cci | Commodity Channel Index | period: 20 | CCI | -100, 0, 100 |
mfi | Money Flow Index | period: 14 | MFI | 20, 80 |
aroon | Aroon | period: 25 | Up, Down | — |
roc | Rate of Change· ソース | period: 12, source: "close" | ROC | 0 |
tsi | True Strength Index· ソース | longPeriod: 25, shortPeriod: 13, signalPeriod: 7, source: "close" | TSI, Signal | 0 |
cmf | Chaikin Money Flow | period: 20 | CMF | — |
stddev | Standard Deviation· ソース | period: 20, source: "close" | StdDev | — |
ad | Accumulation/Distribution | — | A/D | — |
vroc | Volume Rate of Change | period: 14 | VROC | 0 |
ao | Awesome Oscillator | fast: 5, slow: 34 | AO | — |
chaikinOsc | Chaikin Oscillator | fast: 3, slow: 10 | Chaikin | — |
voldelta | Volume Delta | mode: 0 | Delta | — |
vortex | Vortex Indicator | period: 14 | VI+, VI− | 1 |
chop | Choppiness Index | period: 14 | CHOP | 38.2, 61.8 |
uo | Ultimate Oscillator | fast: 7, mid: 14, slow: 28 | UO | 30, 70 |
fi | Force Index | period: 13 | EFI | 0 |
crsi | Connors RSI· ソース | rsiPeriod: 3, streakPeriod: 2, rankPeriod: 100, source: "close" | CRSI | 10, 90 |
coppock | Coppock Curve· ソース | longRoc: 14, shortRoc: 11, wma: 10, source: "close" | Coppock | 0 |
kst | Know Sure Thing· ソース | roc1: 10, roc2: 15, roc3: 20, roc4: 30, sma1: 10, sma2: 10, sma3: 10, sma4: 15, signal: 9, source: "close" | KST, Signal | 0 |
elderray | Elder Ray | period: 13 | Bull, Bear | — |
stc | Schaff Trend Cycle· ソース | fast: 23, slow: 50, cycle: 10, source: "close" | STC | 25, 75 |
kvo | Klinger Oscillator | fast: 34, slow: 55, signal: 13 | KVO, Signal | 0 |
fisher | Fisher Transform | period: 9 | Fisher, Trigger | 0 |
dpo | Detrended Price Oscillator· ソース | period: 20, source: "close" | DPO | — |
bop | Balance of Power | smooth: 14 | BOP | 0 |
massindex | Mass Index | ema: 9, sum: 25 | Mass | 26.5, 27 |
cmo | Chande Momentum· ソース | period: 9, source: "close" | CMO | -50, 0, 50 |
trix | TRIX· ソース | period: 15, signal: 9, source: "close" | TRIX, Signal | 0 |
emv | Ease of Movement | period: 14 | EOM | 0 |
pvt | Price Volume Trend | — | PVT | — |
wad | Williams A/D | — | WAD | — |
chaikinvol | Chaikin Volatility | ema: 10, roc: 10 | CV | 0 |
rvi | Relative Vigor Index | period: 10 | RVGI, Signal | 0 |
stochrsi | Stochastic RSI· ソース | rsiPeriod: 14, stochPeriod: 14, k: 3, d: 3, source: "close" | %K, %D | 20, 80 |
ppo | Percentage Price Oscillator· ソース | fast: 12, slow: 26, signal: 9, source: "close" | Histogram, PPO, Signal | 0 |
ac | Accelerator Oscillator | — | AC | — |
rmi | Relative Momentum Index· ソース | period: 20, momentum: 5, source: "close" | RMI | 30, 70 |
disparity | Disparity Index· ソース | period: 14, source: "close" | DI | 0 |
qstick | Qstick | period: 8 | Qstick | 0 |
pgo | Pretty Good Oscillator | period: 14 | PGO | -3, 0, 3 |
bbpb | Bollinger Bands %B· ソース | period: 20, stdDev: 2, source: "close" | %B | 0, 0.5, 1 |
bbw | Bollinger BandWidth· ソース | period: 20, stdDev: 2, source: "close" | BBW | — |
mom | Momentum· ソース | period: 10, source: "close" | MOM | 0 |
hv | Historical Volatility· ソース | period: 10, annual: 365, source: "close" | HV | — |
vo | Volume Oscillator | short: 5, long: 10 | Vol Osc | 0 |
ulcer | Ulcer Index· ソース | period: 14, source: "close" | Ulcer | — |
smi | Stochastic Momentum Index | period: 10, smooth: 3, signal: 3 | SMI, Signal | 40, -40 |
rvix | Relative Volatility Index | period: 10, smooth: 14 | RVI | 80, 50, 20 |
trendstrength | Trend Strength Index | period: 14 | Trend | 0 |
lrslope | Linear Regression Slope | period: 14 | Slope | 0 |
stderror | Standard Error | period: 14 | StdErr | — |
adr | Average Day Range | period: 14 | ADR | — |
netvolume | Net Volume | — | Net | 0 |
asi | Accumulative Swing Index | limit: 10 | ASI | — |
advdecline | Advance/Decline | length: 10 | Ratio | — |
majority | Majority Rule | period: 14 | Majority | 50 |
chopzone | Chop Zone | — | Angle | — |
smiergodic | SMI Ergodic· ソース | short: 5, long: 20, signal: 5, source: "close" | Oscillator, Indicator, Signal | — |
po | Price Oscillator· ソース | short: 10, long: 21, source: "close" | PO | — |
volohlc | Volatility O-H-L-C | period: 10, annual: 365 | Volatility | — |
volzt | Volatility Zero Trend Close-to-Close | period: 10, annual: 365 | Volatility | — |
psy | Psychological Line | period: 10 | PSY | 25, 75 |
newpsy | New Psychological Line | period: 10 | New PSY | -50, 0, 50 |
vr | Volume Ratio | period: 20 | VR | 70, 150, 450 |
abratio | AB Ratio | period: 26 | A, B | 100 |
sonar | Sonar | period: 20, lookback: 9, signal: 9 | Sonar, Signal | 0 |
sigma | Sigma | period: 20 | Sigma | -2, 0, 2 |
vhf | Vertical Horizontal Filter | period: 28 | VHF | — |
rsquared | R-Squared | period: 14 | R² | — |
rwi | Random Walk Index | period: 14 | RWI High, RWI Low | 1 |
nvi | Negative Volume Index | signal: 255 | NVI, Signal | — |
pvi | Positive Volume Index | signal: 255 | PVI, Signal | — |
tr | True Range | — | TR | — |
iii | Intraday Intensity | period: 21 | III % | 0 |
volpct | Volume vs Average | period: 20 | Vol % | 0 |
volchange | Volume Change | — | Volume | — |
tradevalue | Trade Value | — | Value | — |
binarywave | Binary Wave | ma: 20, fast: 12, slow: 26, signal: 9, roc: 12, stoch: 14 | Wave | 0 |
sroc | Smoothed Rate of Change | ema: 13, roc: 21 | S-ROC | 0 |
voldelta(Volume Delta)は、OHLCV から買い / 売りの圧力を近似します。上昇して引けたバーは
出来高をプラス、下落したバーはマイナスとして加えます。mode: 0 はバーごとのヒストグラム、 mode: 1 は累積デルタです。(本来のティックデルタには約定ごとの bid / ask データが必要ですが、
OHLCV の系列にはその情報が含まれていません。)
アジアの相場ソフトでおなじみの指標
韓国、日本、ベトナムのトレーダーが相場ソフトで使い慣れた指標:サイコロジカルライン(psy)と新サイコロジカルライン(newpsy)、ボリュームレシオ(vr)、AB レシオ(abratio)、sonar、sigma、バイナリーウェーブ(binarywave)、売買代金(tradevalue)と出来高増減(volchange)、DeMark の予測レンジ(demark)、最大 20 本の移動平均レインボー(rainbow)。売買代金は各足の終値 × 出来高による推定値で、取引所の公式値はそのデータフィードにあります。
chart.addIndicator('psy', { period: 10 }, 'bottom')              // 上昇引けの割合。25 と 75 を表示
chart.addIndicator('vr', { period: 20 }, 'bottom')                // 上昇日と下落日の出来高の比
chart.addIndicator('tradevalue', {}, 'bottom')                    // 各足の終値 × 出来高
chart.addIndicator('rainbow', { first: 10, step: 10, count: 10 }) // 10〜100 本の 10 本の平均線
ローソク足パターン
1〜5 本の足からなる 64 パターン:十字線、カラカサと流れ星、丸坊主と寄り付き坊主;包み足、はらみ線、切り込み線とかぶせ線、毛抜き、キッキング;明けの明星と宵の明星、捨て子線、赤三兵と三羽烏、スリーインサイドとスリーアウトサイド、タスキ;スリーラインストライク、三法、マットホールド、ブレイクアウェイ、ラダーボトム。反転パターンは反転する対象のトレンドの後でのみ数え(パターン前の終値が 10 本平均と 10 本前の終値の両方を超えていること、trendPeriod)、実体の長短はそれ以前の足の平均実体と比べます。指標は強気パターンの下、弱気パターンの上に矢印を描き、足の幅が十分なら略称を添えます。複数のパターンが終わる足では最も長いものを表示します。reversal、continuation、indecision(1 か 0)で種類を選びます。
chart.addIndicator('candlepatterns')                  // パターンが終わる足ごとに矢印と名前
chart.addIndicator('candlepatterns', { indecision: 1 }) // 十字線やコマも表示

import { detectCandlePatterns, CANDLE_PATTERNS } from '@tradecanvas/chart'

const found = detectCandlePatterns(bars, { patterns: ['bullishEngulfing', 'hammer'] })
// [{ index, time, pattern: { id, name, short, direction, kind, bars } }]
CANDLE_PATTERNS.length                                 // 64
独自のインジケーター
IndicatorBase を継承し、描画する内容(plots)、ペインのスケール、レベル、
入力を宣言します。描画のコードを書かなくても、チャートが描画し、ペインのスケールを調整し、値をタグ表示し、
ウィジェットの凡例と設定に表示します。詳しくは カスタムインジケーターのレシピを参照してください。
ペイン:サイズ変更、折りたたみ、最大化、並べ替え
ペインの上の区切り線をドラッグしてサイズを変えます。 ChartWidget では各ペインの右上にボタンがあり、上下への移動、ヘッダーだけへの折りたたみ、 最大化(ほかのペインは折りたたまれ、価格ペインは細い帯として残ります)ができます。 保存したレイアウトには、各ペインのサイズ、順序、折りたたみ、最大化の状態が残ります。コードからも同じことができます:
chart.setPanelSize(rsi, 180)        // px, clamped to a minimum
chart.setPaneCollapsed(macd, true)  // fold to its header
chart.setMaximizedPane(rsi)         // null puts the panes back
chart.movePane(rsi, -1)             // one place up; 1 = down
chart.on('paneChange', (e) => e.payload.change)  // 'collapsed' | 'maximized' | 'order' | 'scale'
chart.setPaneScale(atr, { log: true, invert: false })  // log while its values are above 0
chart.setPaneScale(atr, { percent: true })             // labels in percent of its first value on screen
ChartWidget でペインを右クリックすると、そのペイン独自の対数スケール、反転スケール、パーセントスケールを設定できます。
インジケーターを別のペインへ移動する
インジケーターは、別のインジケーターのペインに加わる(そのペインのスケールを共有します)、独自のペインを持つ、 価格ペインに戻る、のいずれもできます。自分が持ち主だったペインを離れても、そのペインのほかのインジケーターは残り (次のペインインジケーターがペインを引き継ぎます)、そのラインを使っているインジケーターは一緒に移動します。 ChartWidget では、凡例の行にある ⋯ ボタンから、上のペイン、下のペイン、新しいペイン、価格ペインを選べます。
chart.moveIndicatorToPane(cci, rsi)      // into RSI's pane
chart.moveIndicatorToPane(cci, 'new')    // a pane of its own
chart.moveIndicatorToPane(ema, 'price')  // an overlay back to the price pane
chart.canMoveIndicatorToPane(cci, rsi)   // whether it would move
元に戻す操作とテンプレート
インジケーターの追加、削除、編集、移動は、描画と同じ履歴に入る元に戻す操作の 1 ステップです (Ctrl/⌘ Z、Ctrl/⌘ Shift Z)。元に戻す操作で復活したインジケーターは元の id のまま戻るので、 そのラインに設定したアラートも引き続き対応します。1 つのインジケーターへの連続した編集(色のドラッグ、期間の入力)は 1 ステップにまとまります。レイアウトを読み込むと、履歴は新しく始まります。
インジケーターは丸ごと取り出して戻すことができ、ChartWidget のインジケーターテンプレートはこの仕組みを使っています。 インジケーターメニューの インジケーターをテンプレートとして保存… で、それら(入力、スタイル、レベル、ペイン)を 名前を付けて保存し、テンプレートを選ぶとチャートのインジケーターがそれに置き換わります。これは 1 回の元に戻す操作にまとまります。
const setup = chart.getIndicatorSetup()   // what a layout keeps of them
chart.applyIndicatorSetup(setup)          // in place of the chart's indicators

new ChartWidget(host, { indicatorTemplates: true })  // the default
チャートの外での計算
IndicatorWorkerHost は、Web Worker が使うのと同じメッセージで、バーからインジケーターを計算します。
ワーカースクリプトはまだ公開パッケージに含まれていないため、null を渡してプラグインを登録し、
その場で計算してください(SSR、テスト、スクリプト向け):
import { IndicatorWorkerHost, RSIIndicator } from '@tradecanvas/core'

const host = new IndicatorWorkerHost(null)
host.registerFallbackPlugin(new RSIIndicator())
const output = await host.calculate('rsi', { id: 'rsi', instanceId: 'rsi-1', params: { period: 14 } }, bars)